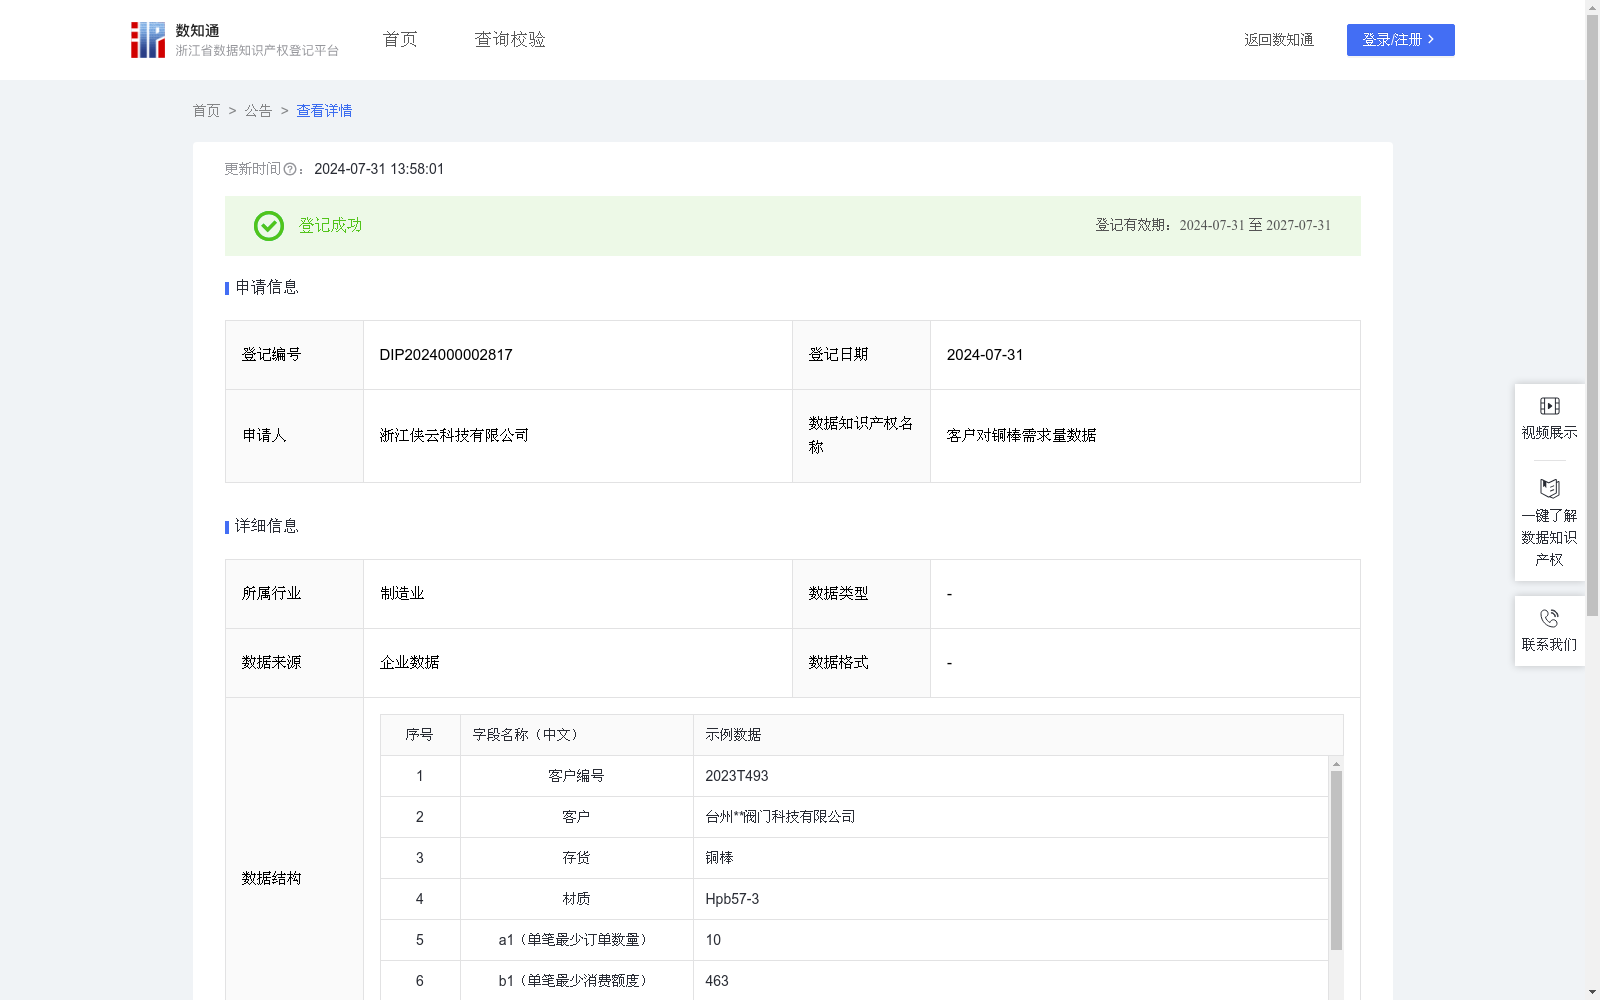
客户对铜棒需求量数据
收藏资源简介:
通过收集和分析客户铜棒相关数据,了解客户对铜棒的购买力水平和消费偏好,从而了解该产品是否畅销,从而制定生产策略能更好地为用户提供个性化的商品和服务。1.数据采集:采集平时客户对铜棒的相关交易数据。2.数据处理:对采集到数据进行分类、合并、累加,便于分析使用。3.算法加工:将处理后的数据进行需求量分析:P=a1(单笔最少订单数量)/a2(单笔最高订单数量)+b1(单笔最少消费额度)/b2(单笔最高消费额度)。4、数据分类分级:根据计算出的需求量水平,将客户等级划分为“高、中、低”不同的类别和级别(小于0.5为低,介于0.5至1之间为中,大于1为高),帮助公司更好地理解客户,从而制定更精准的营销策略。
This dataset is constructed by collecting and analyzing customer data related to copper rods, aiming to understand customers' purchasing power and consumption preferences for copper rods, assess the market sales performance of this product, and formulate production strategies to better provide personalized products and services for users. 1. Data Collection: Collect daily transaction data related to copper rods from customers. 2. Data Preprocessing: Classify, merge and accumulate the collected data to facilitate subsequent analysis. 3. Algorithm-based Demand Analysis: Conduct demand analysis on the preprocessed data using the formula: P = a1(minimum single-order quantity)/a2(maximum single-order quantity) + b1(minimum single-order consumption amount)/b2(maximum single-order consumption amount). 4. Data Classification and Grading: Divide customers into three categories: high, medium and low based on the calculated demand level, where customers with P < 0.5 are classified as low tier, those with 0.5 ≤ P ≤ 1 as medium tier, and those with P > 1 as high tier, to help the company better understand customers and formulate more precise marketing strategies.