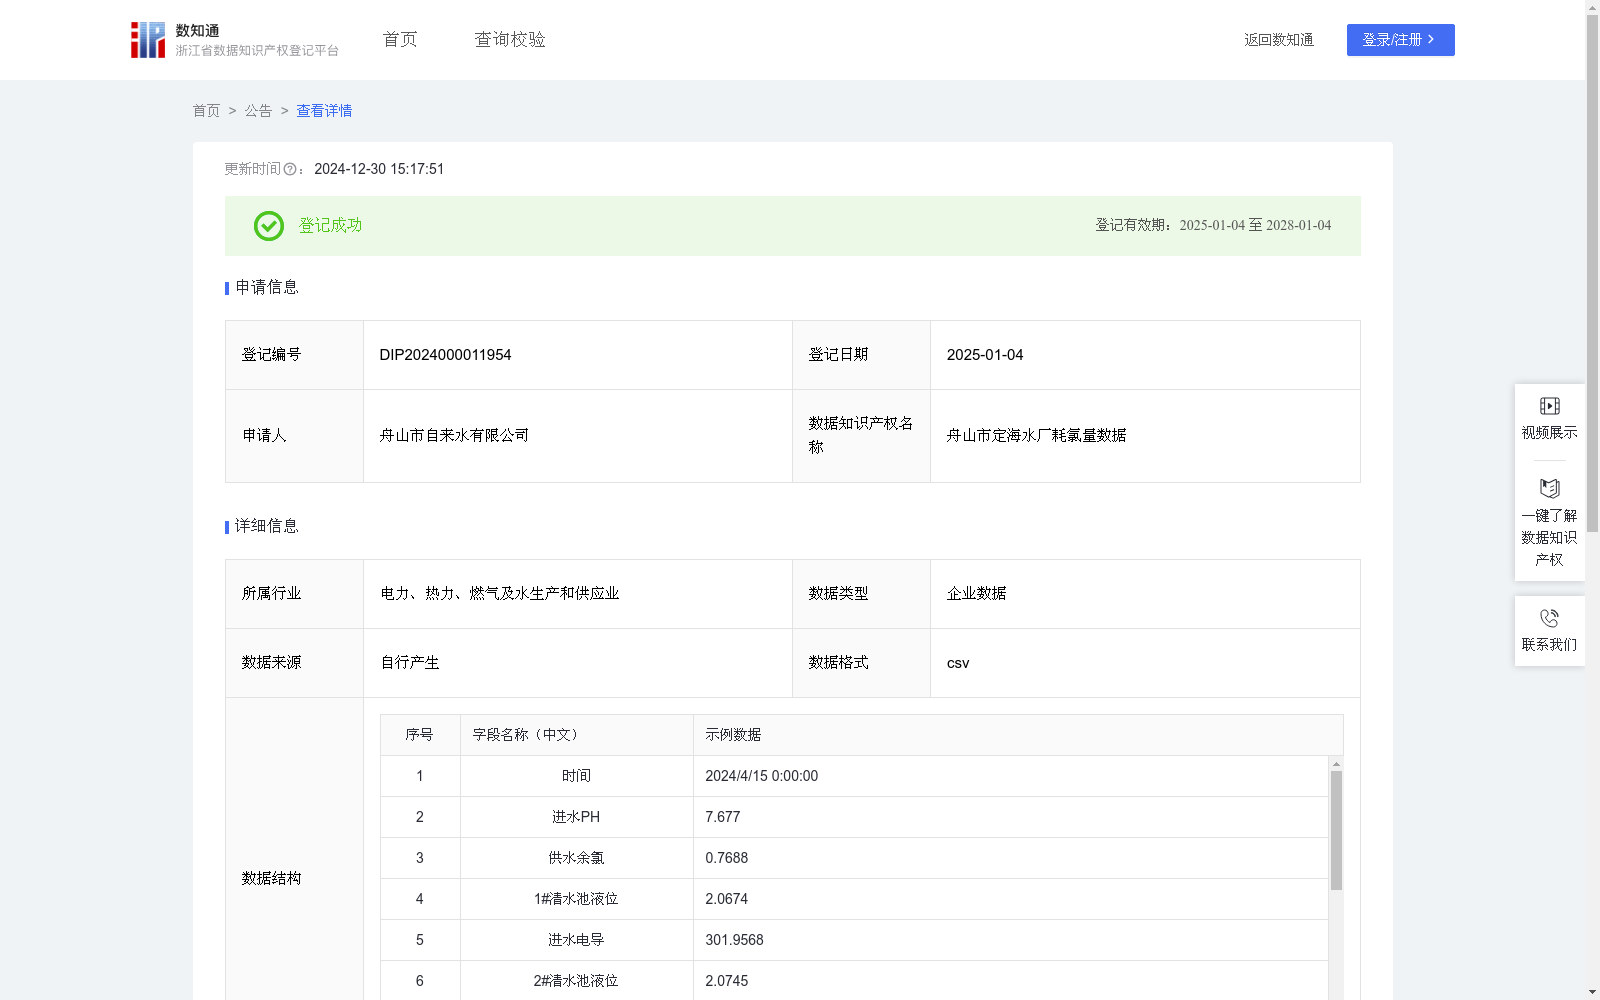
舟山市定海水厂耗氯量数据
收藏资源简介:
为水厂等相关行业生产中的耗氯量投加提供数据支持与对比,为次氯酸钠药剂精准控制、节能降耗等各类模型提供数据依据,相同生产规模的水厂可以参照此模型直接指导药剂配比和投加量控制,从而帮助水厂实现水质稳定条件下的降低药耗;此外,该数据结论还能为次氯酸钠药剂厂家提供相关参考数据,指导药剂生产。舟山市定海水厂耗氯量数据算法包括以下步骤: 1、数据采集:进水PH、供水余氯、1#清水池液位、进水电导、2#清水池液位、1#供水流量、2#供水流量、1#后加氯流量、2#后加氯流量、次氯酸钠浓度配比、1#进水流量、2#进水流量以及时间; 2、数据处理:在采集到的数据中,筛选0.7≤供水余氯值≤0.9的数据。 3、模型构建:构建1#实际单耗氯量、2#实际单耗氯量与进水PH、供水余氯、1#清水池液位、进水电导、2#清水池液位、1#供水流量、2#供水流量、1#后加氯流量、2#后加氯流量、次氯酸钠浓度配比、1#进水流量、2#进水流量等指标的数据模型, 公式为:1#实际单耗氯量=a1*进水PH+a2*供水余氯+a3*1#清水池液位+a4*进水电导+a5*2#清水池液位+a6*1#供水流量+a7*2#供水流量+a8*1#后加氯流量+a9*2#后加氯流量+a10*次氯酸钠浓度配比+a11*1#进水流量+a12*2#供水流量,2#实际单耗氯量=b1*进水PH+b2*供水余氯+b3*1#清水池液位+b4*进水电导+b5*2#清水池液位+b6*1#供水流量+b7*2#供水流量+b8*1#后加氯流量+b9*2#后加氯流量+b10*次氯酸钠浓度配比+b11*1#进水流量+b12*2#供水流量,其中a1至a12为各输入要素的一次项与1#实际单耗氯量间的关系系数,b1至b12为各输入要素的一次项与2#实际单耗氯量间的关系系数。
This dataset provides data support and comparison for chlorine dosage application in water production plants and related industries, and offers data basis for various models including precise control of sodium hypochlorite chemicals, energy saving and consumption reduction. Water plants with identical production scales can refer to this model to directly guide chemical ratio and dosage control, thus helping water plants reduce chemical consumption while maintaining stable water quality. In addition, the data conclusions can also provide relevant reference data for sodium hypochlorite chemical manufacturers to guide their production. The chlorine consumption data algorithm for Dinghai Water Plant in Zhoushan City includes the following steps: 1. Data collection: Influent pH, residual chlorine in water supply, liquid level of No.1 clean water tank, influent electrical conductivity, liquid level of No.2 clean water tank, No.1 water supply flow rate, No.2 water supply flow rate, No.1 post-chlorination flow rate, No.2 post-chlorination flow rate, sodium hypochlorite concentration ratio, No.1 influent flow rate, No.2 influent flow rate, and timestamp. 2. Data processing: Screen the collected data where 0.7 ≤ residual chlorine in water supply ≤ 0.9. 3. Model construction: Construct a data model for the actual specific chlorine consumption of No.1 and No.2 units, with the following input indicators: influent pH, residual chlorine in water supply, liquid level of No.1 clean water tank, influent electrical conductivity, liquid level of No.2 clean water tank, No.1 water supply flow rate, No.2 water supply flow rate, No.1 post-chlorination flow rate, No.2 post-chlorination flow rate, sodium hypochlorite concentration ratio, No.1 influent flow rate, and No.2 influent flow rate. The formulas are as follows: Actual specific chlorine consumption of No.1 unit: $C_1 = a_1 imes ext{influent pH} + a_2 imes ext{residual chlorine in water supply} + a_3 imes ext{liquid level of No.1 clean water tank} + a_4 imes ext{influent electrical conductivity} + a_5 imes ext{liquid level of No.2 clean water tank} + a_6 imes ext{No.1 water supply flow rate} + a_7 imes ext{No.2 water supply flow rate} + a_8 imes ext{No.1 post-chlorination flow rate} + a_9 imes ext{No.2 post-chlorination flow rate} + a_{10} imes ext{sodium hypochlorite concentration ratio} + a_{11} imes ext{No.1 influent flow rate} + a_{12} imes ext{No.2 water supply flow rate}$ Actual specific chlorine consumption of No.2 unit: $C_2 = b_1 imes ext{influent pH} + b_2 imes ext{residual chlorine in water supply} + b_3 imes ext{liquid level of No.1 clean water tank} + b_4 imes ext{influent electrical conductivity} + b_5 imes ext{liquid level of No.2 clean water tank} + b_6 imes ext{No.1 water supply flow rate} + b_7 imes ext{No.2 water supply flow rate} + b_8 imes ext{No.1 post-chlorination flow rate} + b_9 imes ext{No.2 post-chlorination flow rate} + b_{10} imes ext{sodium hypochlorite concentration ratio} + b_{11} imes ext{No.1 influent flow rate} + b_{12} imes ext{No.2 water supply flow rate}$ Where $a_1$ to $a_{12}$ are the correlation coefficients between the linear term of each input factor and the actual specific chlorine consumption of No.1 unit, and $b_1$ to $b_{12}$ are the correlation coefficients between the linear term of each input factor and the actual specific chlorine consumption of No.2 unit.