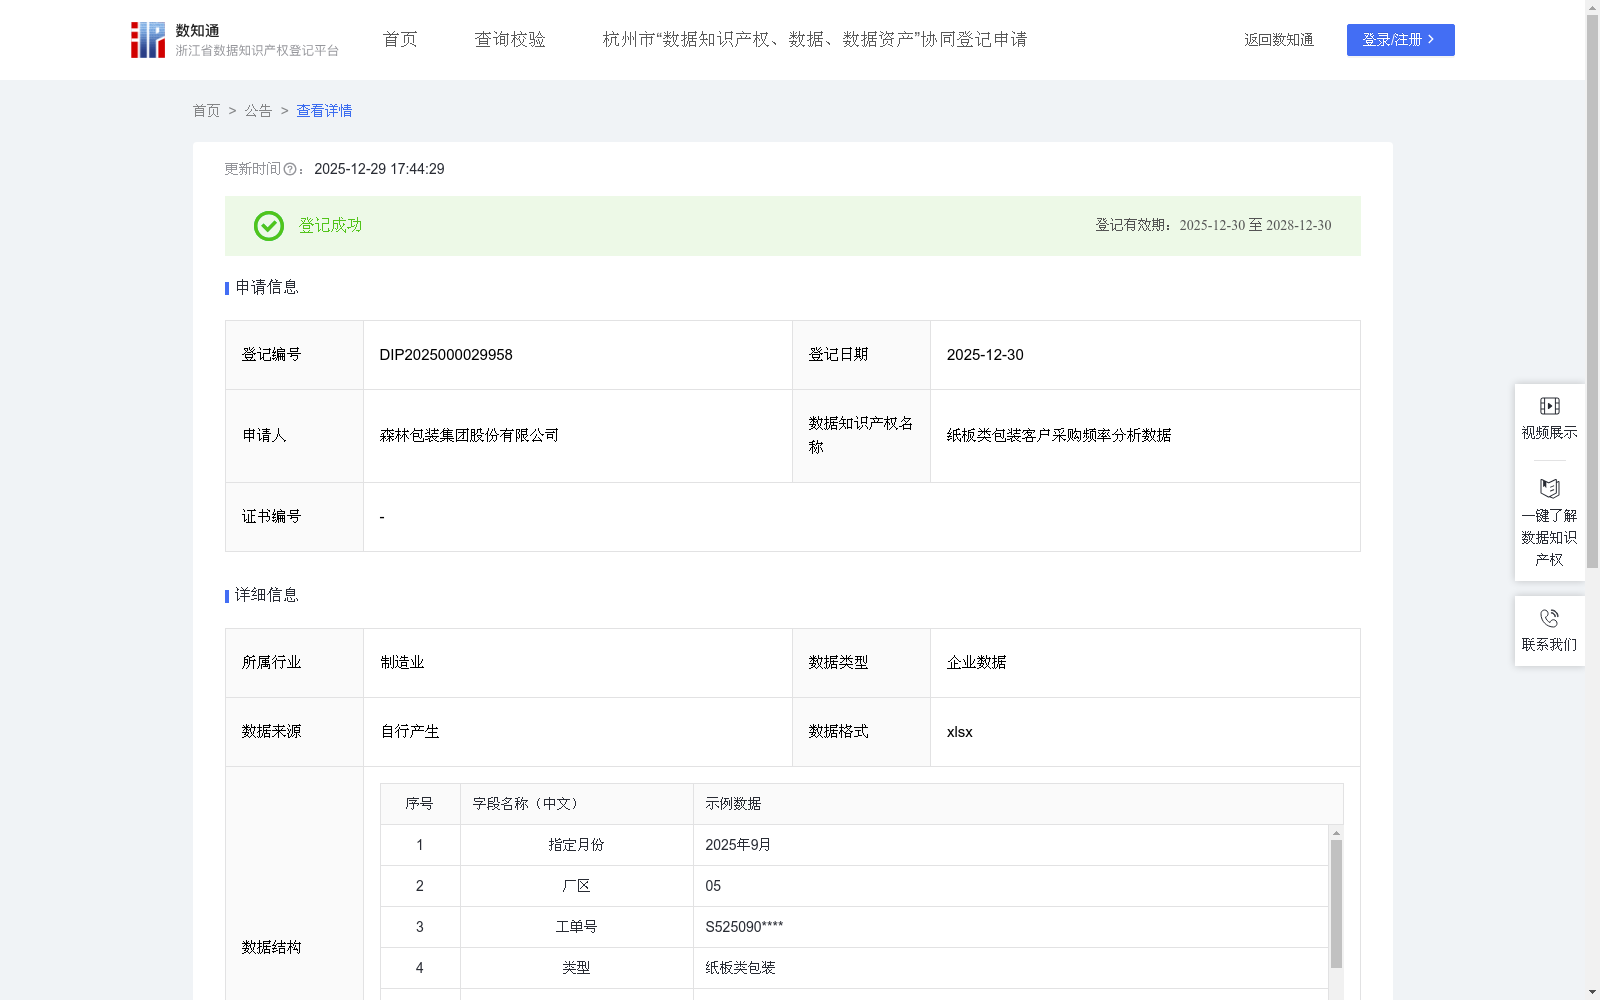
纸板类包装客户采购频率分析数据
收藏资源简介:
通过统计各客户对纸板类包装的月度采购天数,精确计算出采购频率,既能捕捉不同客户的需求波动与稳定性特征,更能折射出纸板类包装行业的需求脉络:采购频率高的客户群体,往往指向行业内高增长细分领域的旺盛需求,为全行业识别市场机会提供数据锚点。依托采购频率排名形成的客户分级,能引导行业资源向高价值合作场景倾斜,推动包装企业集中技术与产能服务核心客户,同时倒逼行业优化产品矩阵,加速从同质化供给向精准化服务转型。而不同客户的采购频率对比,更能直观反映行业需求结构的健康度,助力企业预判行业周期波动,进而带动全行业构建需求与供给动态平衡的协同生态,提升纸板类包装领域的整体市场活力与竞争力。1.数据统计:根据销售记录(工单号)采集不同客户代码(唯一标识)在指定月份的采购行为,对客户当月的开单时间去重后计数,得到采购天数(N)。 2.数据分析:指定月份的整月天数为 T(例如9月份为30天)。计算平均采购间隔时间 I=T/N,采购频率F=1/I。 3.客户排名:将当月所有客户的采购频率(F值)从高到低进行排序,生成“采购频率排名”。 4.客户分级规则:依据上述采购频率排名结果,将客户划分为“高等级”“中等级”“低等级”三个类别。其中,采购频率排名前5名的客户为“高等级”,第6-12名为“中等级”,第13名及以后为“低等级”。
By counting the monthly purchasing days of each customer for paperboard packaging and accurately calculating the purchasing frequency, this dataset can not only capture the demand fluctuation and stability characteristics of different customers, but also reflect the demand trends of the paperboard packaging industry. Customers with high purchasing frequency usually correspond to the booming demand of high-growth market segments within the industry, providing data anchors for the entire industry to identify market opportunities. Customer classification based on purchasing frequency rankings can guide industry resources to tilt towards high-value cooperation scenarios, prompting packaging enterprises to concentrate technologies and production capacities to serve core customers, while forcing the industry to optimize its product portfolio and accelerate the transformation from homogeneous supply to precise service. By comparing the purchasing frequencies of different customers, the health of the industry's demand structure can be intuitively reflected, helping enterprises predict industry cycle fluctuations, thereby driving the entire industry to build a collaborative ecosystem of dynamic balance between demand and supply, and enhancing the overall market vitality and competitiveness of the paperboard packaging sector. 1. Data Statistics: Collect purchasing behaviors of customers with unique customer codes (unique identifiers) in specified months based on sales records (work order numbers). Count the deduplicated billing times of each customer in the current month to obtain the number of purchasing days (N). 2. Data Analysis: Let T be the total number of days in the specified month (e.g., 30 days for September). Calculate the average purchasing interval I = T/N, and the purchasing frequency F = 1/I. 3. Customer Ranking: Sort the purchasing frequencies (F values) of all customers in the current month in descending order to generate the "Purchasing Frequency Ranking". 4. Customer Classification Rules: Divide customers into three categories: "High-tier", "Mid-tier", and "Low-tier" based on the above purchasing frequency ranking results. Specifically, customers ranked top 5 are "High-tier", those ranked 6th to 12th are "Mid-tier", and those ranked 13th and below are "Low-tier".