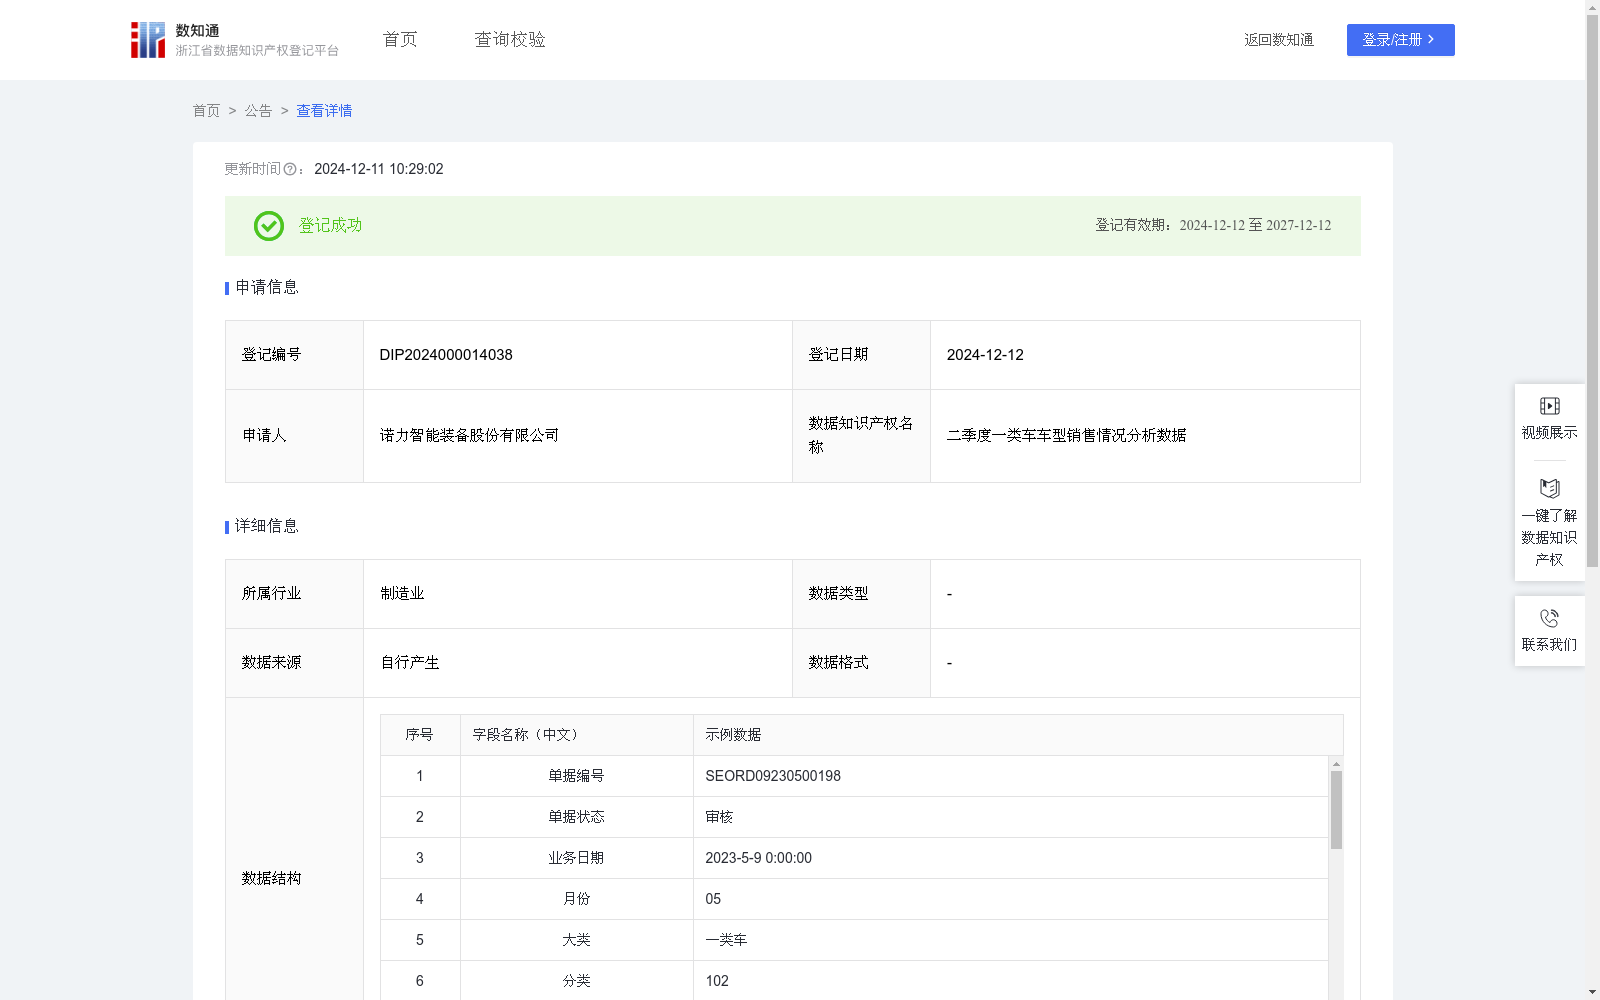
二季度一类车车型销售情况分析数据
收藏资源简介:
通过采集二季度一类车产品的销售订单,计算一类车大类中不同型号的销售金额及销量占比,用来评价一类车类别车型的销售情况。应用于评估生产和销售策略,生产、供货企业可以通过该数据算法了解不同产品的销售情况,调整产业结构,掌握市场动向,统筹生产经营,帮助预测市场趋势,降低因市场波动造成的损失,依托数据资料构建产业产品销售趋势图,帮助管理层对一类车车型制定针对性的营销策略和相应优惠政策,并为企业生产规划提供有效的数据支持,对全行业具有示范指导作用。1:采集二季度本公司一类车的销售订单,输入数据内容包括单据编号,单据状态,业务日期,月份,大类,分类,物料编码,物料名称,计量单位,数量。2.算法描述:利用SUM函数计算不同车型的总销售额,要求单据状态不为历史版本,总销售额=SUM(订单台量x订单车辆单价),输出不同车型销售额占比,销售额占比=某车型总销售额/本季度一类车大类销售总额;4:依靠市场经验将车型销售情况进行分级评价,当销售额占比达到40%时,评价该车型销售情况为A级产品。当销售额占比为10%-40%时,评价该车型销售情况为B级产品。当销售额占比为0-10%时,评价该车型销售情况为C级产品。对于A级产品,可提高生产和供货数量;对于B级产品,需按固定周期关注该产品的销售情况,适当调整生产和供货策略;而对于C级产品,需每月关注该车型销售情况,了解其销售情况变化,以适应大幅度调整经营策略的需要。
This dataset is constructed by collecting sales orders of Class 1 vehicle products in the second quarter, and calculating the sales amount and sales volume proportion of different models under the Class 1 vehicle category to evaluate the sales performance of vehicles in this category. It is applied to evaluate production and sales strategies. Production and supply enterprises can use this dataset and its algorithm to understand the sales performance of different products, adjust industrial structure, grasp market trends, coordinate production and operation, help predict market trends, reduce losses caused by market fluctuations, build industrial product sales trend charts based on collected data, assist management in formulating targeted marketing strategies and corresponding preferential policies for Class 1 vehicle models, provide effective data support for enterprise production planning, and play a demonstrative and guiding role for the entire industry. 1. Data Collection: Collect sales orders of Class 1 vehicles of the company in the second quarter. The input data includes document number, document status, business date, month, major category, sub-category, material code, material name, unit of measurement, and quantity. 2. Algorithm Description: Calculate the total sales amount of different models using the SUM function, with the requirement that the document status is not a historical version. The total sales amount = SUM(quantity of ordered vehicles × unit price of ordered vehicles). Output the sales proportion of different models, where sales proportion = total sales amount of a certain model / total sales amount of the Class 1 vehicle category in the second quarter; 4. Grading Evaluation: Grade the sales performance of models based on market experience: - Grade A products: when the sales proportion reaches 40%; - Grade B products: when the sales proportion is between 10% and 40%; - Grade C products: when the sales proportion is between 0% and 10%. For Grade A products, the production and supply quantity can be increased; for Grade B products, the sales performance of the product needs to be monitored at fixed intervals, and production and supply strategies should be adjusted appropriately; for Grade C products, the sales performance of the model needs to be monitored monthly to understand changes in its sales situation, so as to adapt to the need of major adjustments to business strategies.