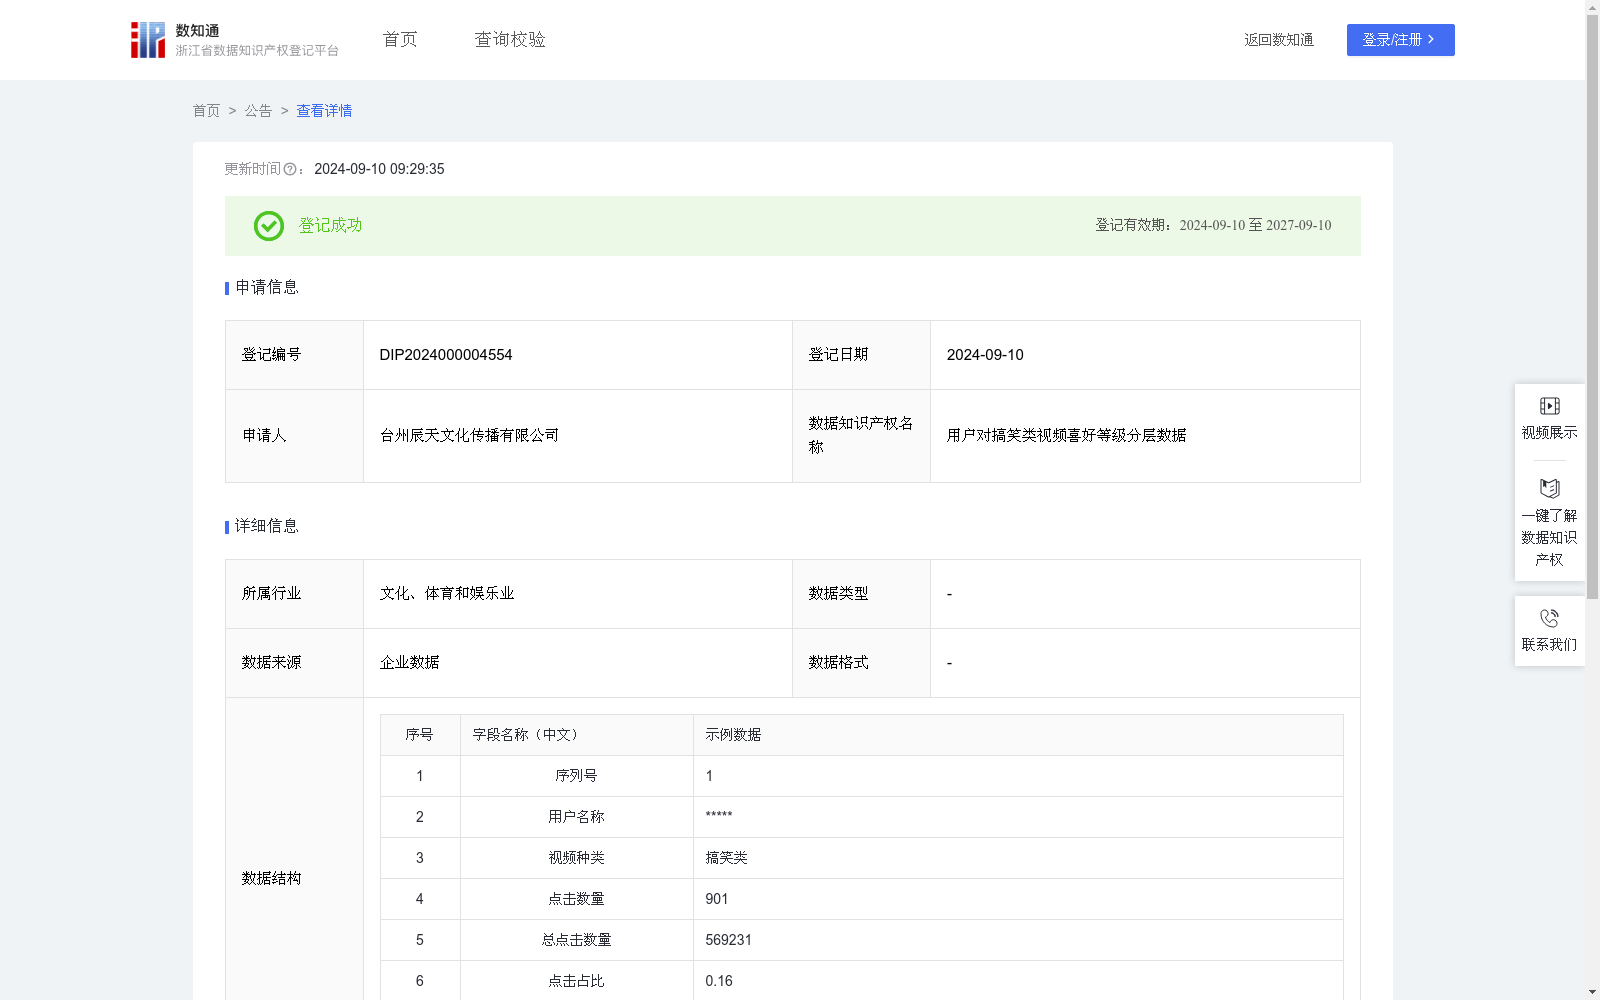
用户对搞笑类视频喜好等级分层数据
收藏资源简介:
在日常生活工作之余,越来越多的人喜欢刷视频来缓解压力,有部分人群对搞笑类视频感兴趣。统计分析用户观看搞笑类视频的数据,通过对历史观看用户建立表格,对用户进行标签制定,定位用户喜好级别,通过大数据推广,为用户推送符合喜好的视频提供数据支持。1. 数据采集:采集用户对搞笑类视频的点击数量等信息; 2. 用户点击数量占总点击数量的比例=用户点击数量/总点击数量*100%; 3. 用户点击数量占总点击数量的比例按从大到小进行排名;分类运用ABCDEF分类法,对占比0.26%以上的,给予“A类用户”分层;占比0.21%到0.25%区间的,则给予“B类用户”分层;占比在0.16%到0.20%区间,则给予“C类用户”分层;占比在0.11%到0.15%区间,则给予“D类用户”分层;占比在0.06%到0.1%区间,则给予“E类用户”分层;占比在0.05%以下,则给予“F类用户”分层; 4. 数据应用: 搞笑类视频的点击次数结果可以作为用户喜好等级评价的依据,为监管部门向监管提供技术支撑。
Against the backdrop of increasing reliance on short video browsing for stress relief amid daily work and life, a growing number of users show heightened interest in comedy-related videos. This dataset focuses on statistical analysis of users' viewing data for comedy videos, to provide data support for targeted video recommendation by establishing tables for historical viewing users, formulating user tags, identifying user preference levels, and leveraging big data-driven promotion. 1. Data Collection: Collect information including the number of clicks users have made on comedy videos; 2. Calculation of Click Proportion: The proportion of a user's clicks in total clicks = (User's click count / Total click count) * 100%; 3. Ranking and Stratification: Rank the calculated proportions in descending order. Apply the ABCDEF classification method for stratification: users with a proportion above 0.26% are classified as "Type A Users"; those with a proportion between 0.21% and 0.25% are "Type B Users"; those with a proportion in the range of 0.16% to 0.20% are "Type C Users"; those in 0.11% to 0.15% are "Type D Users"; those in 0.06% to 0.10% are "Type E Users"; and those with a proportion below 0.05% are "Type F Users"; 4. Data Application: The click count results of comedy videos can be used as a basis for evaluating user preference levels, providing technical support for regulatory authorities to carry out supervision work.