Isomorph2026/isomorph-supply-chain-benchmark
收藏资源简介:
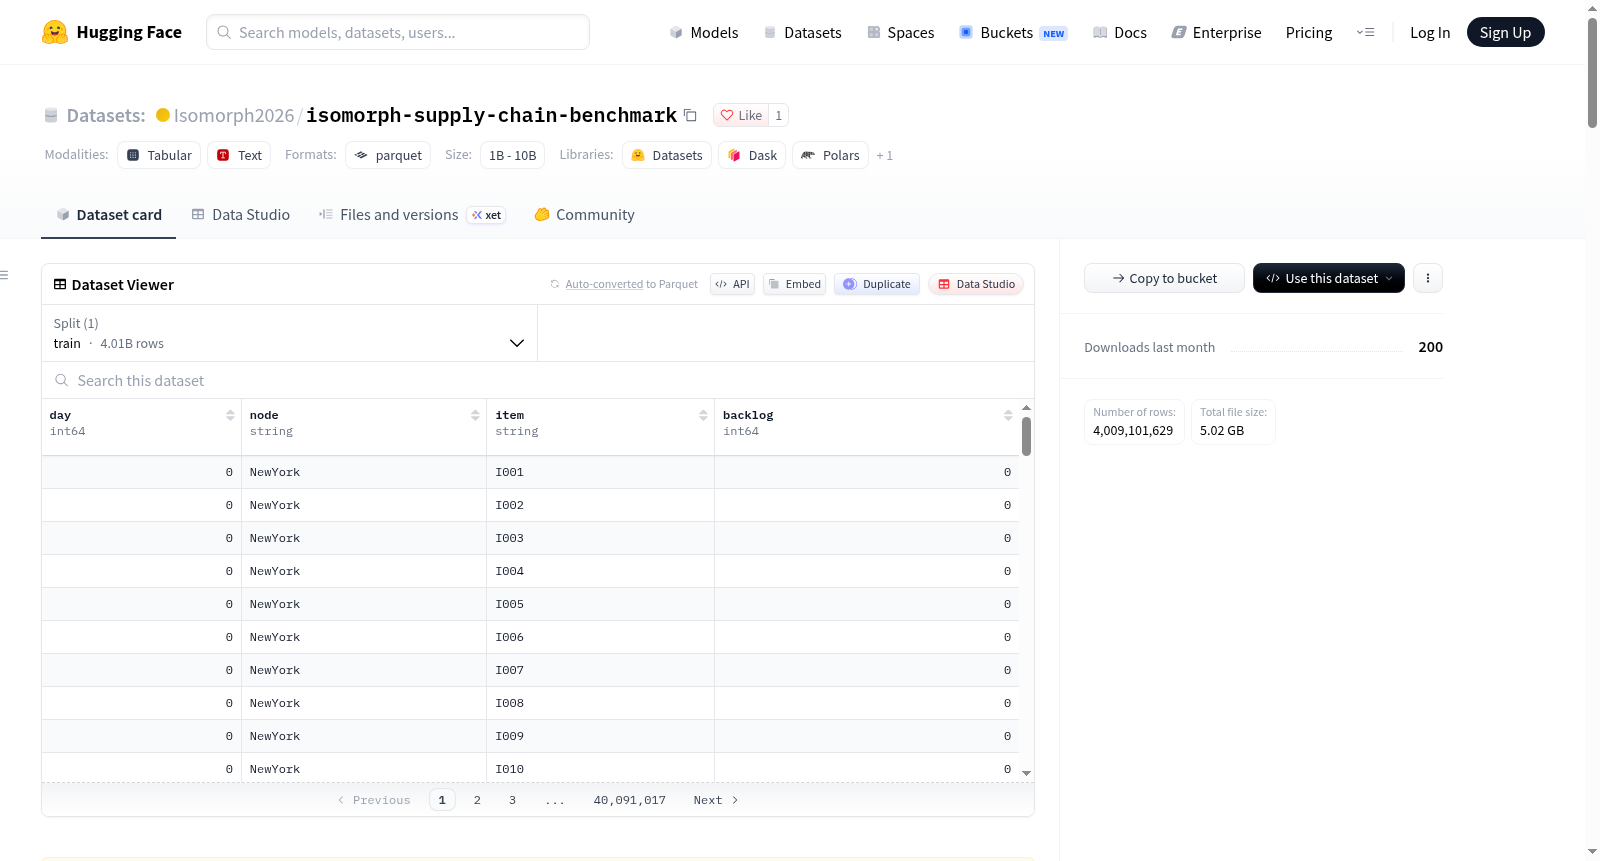
# ISOMORPH Full The full ISOMORPH dataset release: 49 rollouts spanning two baselines, 27 mixture scenarios, and 20 Latin-hypercube UQ perturbations. We release multivariate logistics time-series data generated by a digital-twin (DT) simulator of a multi-echelon supply chain with an explicit routing network, with the underlying dynamics formulated as a Markov chain. All runs use seed 2025 and horizon T = 52,560. ## Overview The simulator advances a directed routing graph of factories, intermediate warehouses, and a customer-facing destination forward in discrete time. At each step, random Poisson customer demand arrives at the destination, is served from on-hand stock, and triggers replenishment along the network. The network is a directed graph $G=(\mathcal{N},\mathcal{E})$ with three node roles (factories, warehouses, destination), integer per-edge transit times $\tau_e$, and per-step volume capacities $K_e V_e$; Dijkstra's algorithm routes every shipment. The dynamics form a Markov chain $\xi_{t+1} = \Psi(\xi_t, y_t, L_t)$, where $\Psi$ is a deterministic transition map and $(y_t, L_t)$ are the only random inputs (Poisson customer demand and Gaussian source lead times). The demand intensity is a five-component sum: yearly seasonality, weekly seasonality, AR(1) drift, per-item bursts, and a shared macro shock that lifts every item's intensity simultaneously. The state vector $\xi_t$ records on-hand stock, backlog, outstanding orders, in-transit shipments, and a smoothed demand estimate at every location for every item. All released rollouts run on the same 13-node US topology (3 sources, 9 warehouses across 5 tiers, NYC destination). ## Contents | Item | Rollouts | Notes | |---------------------|---------:|--------------------------------------| | `manifest.csv` | 49 | One row per rollout | | `output_item50/` | 1 | Baseline, C = 50 | | `output_item200/` | 1 | Baseline, C = 200 | | `output_mixture/` | 27 | Scenario sweeps (see below) | | `output_uq/` | 20 | LHS perturbations (see below) | The C=50 baseline scenario is reachable via two manifest rows: `output_item50` (the standalone baseline) and `output_mixture/baseline` (the reference point for the mixture sweeps). Both describe the same simulator configuration. Approximate on-disk size: ~99 GB. ## Mixture scenarios (27) Six one-at-a-time sweeps plus two compound runs, all on the C = 50 catalogue. Each sweep varies one or two knobs; the rest stay at baseline. Per-row settings are in `manifest.csv`. | Sweep | Knobs perturbed | Settings (5 each) | |------------|----------------------------------------------|-----------------------------------------------| | Drift | `phi_lo`, `phi_hi` | 0.71, 0.86, 0.96, 0.99, **0.9993** | | Shock | `shock_count_scale`, `shock_height_scale` | (0,1), (0.5,0.7), **(1,1)**, (2,2), (3,4) | | Burst | `burst_rate_scale`, `burst_height_scale` | **(1,1)**, (1.5,2), (2,3), (3,4), (5,8) | | Edge cap | `containers_scale` | 0.3, 0.6, **1.0**, 1.5, 2.5 | | Buffer | `ss_scale` | 0.1, 0.2, 0.5, 0.75, **1.0** | | Lead time | `leadtime_scale` | **1.0**, 2.0, 5.0, 10.0, 20.0 | The bold setting in each sweep is the baseline configuration for that knob (drift's baseline is φ^AR ≈ 0.9993; the other five sweeps have a 1.0 multiplier). All six baseline-equivalent settings produce the same simulation and share a single `output_mixture/baseline` rollout, so the 30 sweep cells materialise as 25 distinct sweep rollouts plus the shared baseline. With 2 compound scenarios, the mixture family contains 27 directories in total. Compound scenarios: | Scenario | Overrides | |------------------|------------------------------------------------------------------------| | `chaos_compound` | `phi_lo=0.96, phi_hi=0.98, shock_count_scale=3, shock_height_scale=4` | | `chaos_burst` | `phi_lo=0.96, phi_hi=0.98, burst_rate_scale=3, burst_height_scale=4` | ## UQ perturbations (20) K = 20 Latin-hypercube samples over three demand-side knobs: - `phi_AR` in [0.95, 0.999], applied to both `phi_lo` and `phi_hi` - `rho_G` in [0.5, 2.0], applied to both `shock_count_scale` and `shock_height_scale` - `rho_B` in [0.5, 2.0], applied to both `burst_rate_scale` and `burst_height_scale` Sampler: `scipy.stats.qmc.LatinHypercube(d=3, seed=2025)`. Per-sample values are in `manifest.csv` rows where `family = uq`. ## Manifest schema `manifest.csv` has one row per rollout and the following columns: | Column | Meaning | |------------------------|-------------------------------------------------------------| | `rollout` | Rollout name (matches the directory under this variant) | | `family` | One of `baseline`, `mixture`, `uq` | | `scenario` | Scenario label within the family | | `n_items` | Catalogue size C (50 or 200) | | `seed` | RNG seed (all released rollouts use 2025) | | `horizon` | Length T in days (52,560 for all released rollouts) | | `path` | Relative path to the rollout directory inside this variant | | `phi_lo`, `phi_hi` | AR(1) coefficient bounds for the demand process | | `shock_count_scale` | Multiplier on per-day shock count | | `shock_height_scale` | Multiplier on shock magnitude | | `burst_rate_scale` | Multiplier on burst arrival rate | | `burst_height_scale` | Multiplier on burst magnitude | | `containers_scale` | Multiplier on edge container counts (capacity) | | `ss_scale` | Multiplier on safety-stock thresholds | | `leadtime_scale` | Multiplier on edge lead times | Every cell is populated; knobs that the rollout did not perturb are filled with the simulator default (`1.0` for the `*_scale` knobs and the baseline `phi_lo = 0.999, phi_hi = 0.9996` for the AR(1) range). Each row is therefore a complete snapshot of the simulator configuration that produced the rollout. Three additional simulator knobs are held fixed across all 49 rollouts and are therefore omitted from the manifest: `seasonal_scale = 1.0`, `base_lambda_lo = 80.0`, `base_lambda_hi = 250.0`. The exact values used by each rollout are still recorded in its `scenario.json` file. ## File schema Directory layout: ``` isomorph_full/ ├── manifest.csv # one row per rollout ├── README.md ├── LICENSE ├── output_item50/ # baseline, C = 50 │ ├── daily_records.parquet │ ├── shipments.parquet │ ├── service_summary.parquet │ ├── inventory_history.parquet │ ├── backlog_history.parquet │ ├── intransit_history.parquet │ ├── demand_signals.npy │ ├── demand_signals_cols.txt │ ├── scenario.json │ ├── edge_list.parquet │ ├── edge_utilisation.npy │ └── edge_saturation.npy ├── output_item200/ # baseline, C = 200 (same files as above) ├── output_mixture/<scenario>/seed2025/ # 27 mixture rollouts (same files as above) └── output_uq/perturb_kNN/seed2025/ # 20 LHS rollouts (same files as above) ``` Each rollout directory contains the following files. `T` is the run horizon (52,560 for released rollouts), `C` is the catalogue size, and `E` is the number of edges in the network. | File | Shape / format | Contents | |----------------------------|-------------------------------|----------------------------------------------------------------------| | `daily_records.parquet` | rows: T x C | Per-day, per-item demand and service: `day, item, demand, served_from_stock, new_backlog_today, dest_on_hand_end_before_ship, dest_backlog_end_before_ship` | | `shipments.parquet` | rows: variable | One row per shipment: `day, arrival_day, from, to, item, units, path_nodes, edge_times` | | `service_summary.parquet` | rows: C | Per-item totals: `total_demand, served_from_stock, new_backlog_added, fill_rate_stock_only` | | `inventory_history.parquet`| rows: T | On-hand inventory over time | | `backlog_history.parquet` | rows: T | Backlog over time | | `intransit_history.parquet`| rows: T | In-transit units over time | | `demand_signals.npy` | array: T x C, float | Item-level demand series (same content as the `demand` column of `daily_records.csv`, dense form) | | `demand_signals_cols.txt` | text | Item IDs in column order of `demand_signals.npy` | | `scenario.json` | JSON | Exact CLI knobs used to produce the rollout | | `edge_list.parquet` | rows: E | Edge metadata: `edge_id, from, to, travel_time_days, container_volume, num_containers, cap_per_day` | | `edge_utilisation.npy` | array: T x E, float | Per-edge fractional utilisation | | `edge_saturation.npy` | array: T x E, float | Per-edge fractional saturation (cap-relative throughput) | ## Quick load ```python import pandas as pd manifest = pd.read_csv("manifest.csv") # Pull all mixture rollouts mix = manifest[manifest.family == "mixture"] # Pull all UQ rollouts uq = manifest[manifest.family == "uq"] # Load a rollout (tabular files are Parquet) row = mix.iloc[0] records = pd.read_parquet(f"{row.path}/daily_records.parquet") ``` ## Reproducing from source Each `manifest.csv` row maps to a single simulator CLI call. See `../../Isomorph_release/README.md` sections 1, 2, and 4. ## Licence CC-BY-4.0 (see `LICENSE`).
The full ISOMORPH dataset release: 49 rollouts spanning two baselines, 27 mixture scenarios, and 20 Latin-hypercube UQ perturbations. We release multivariate logistics time-series data generated by a digital-twin (DT) simulator of a multi-echelon supply chain with an explicit routing network, with the underlying dynamics formulated as a Markov chain. All runs use seed 2025 and horizon T = 52,560.