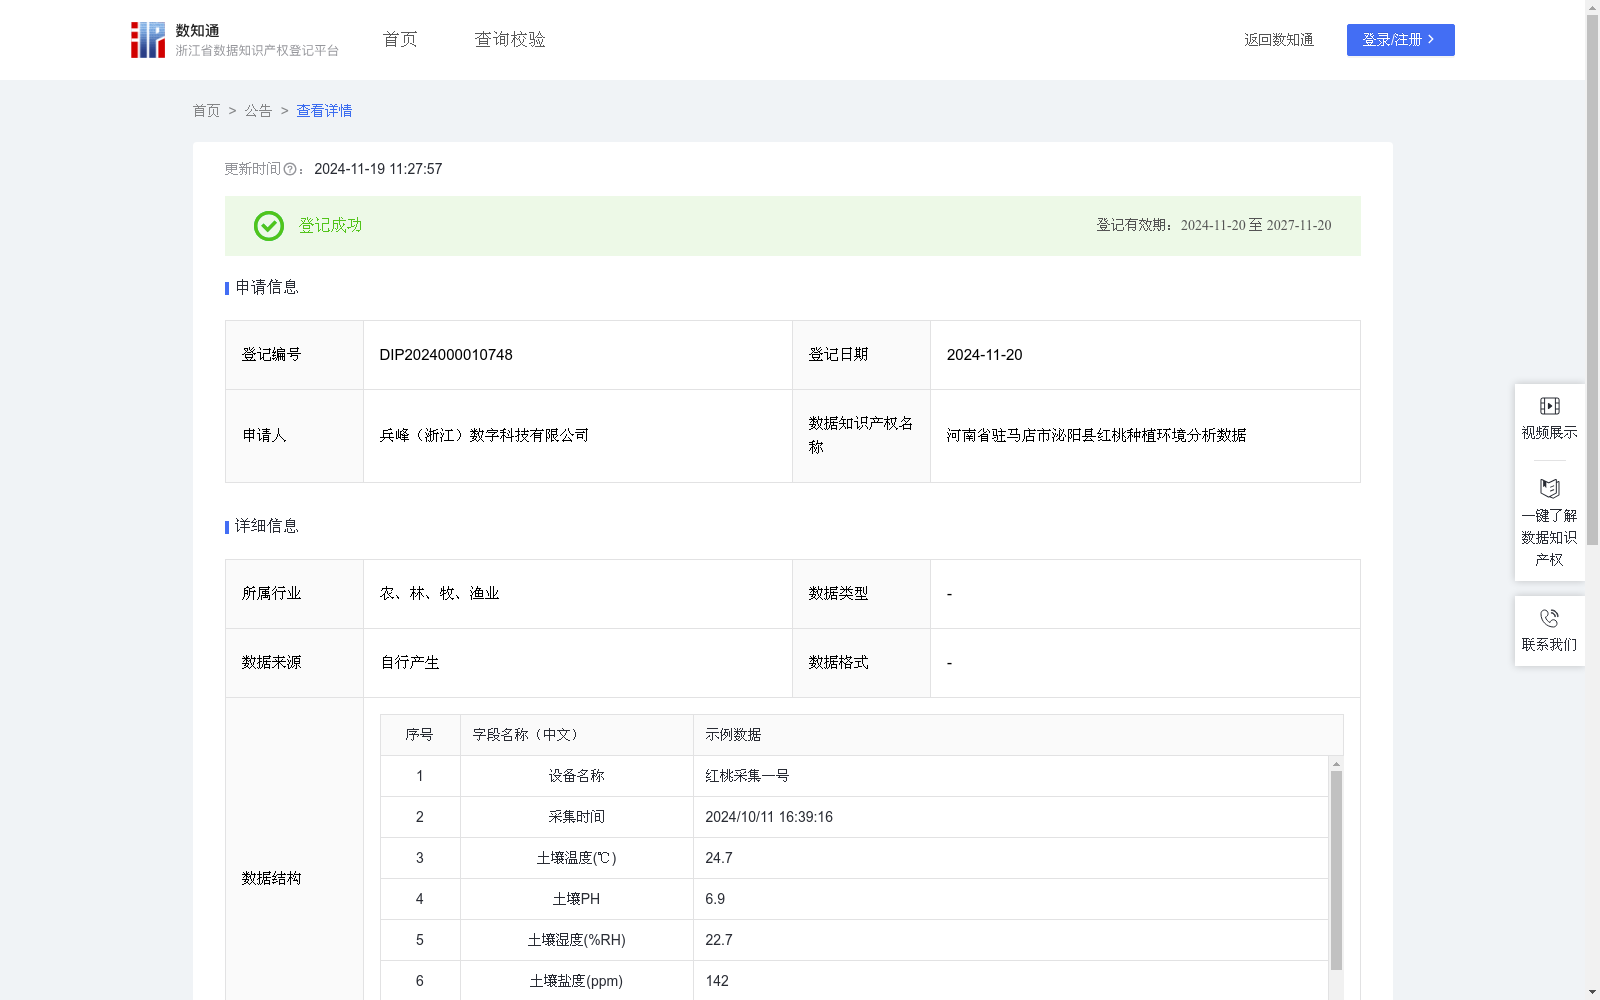
河南省驻马店市泌阳县红桃种植环境分析数据
收藏资源简介:
采集红桃种植的土壤湿温度、土壤盐度、土壤PH、土壤电导率等数据,对于精细化管理果园、优化生长环境、提升果实品质具有关键作用。这些数据为种植者提供了土壤健康状况的实时反馈,有助于他们精准调控灌溉量、施肥方案及土壤改良措施。通过监测土壤湿度与温度,种植者能及时调整灌溉计划,确保红桃根系处于适宜的水分环境中,促进营养吸收与果实发育。土壤盐度与电导率的测定则帮助识别土壤盐碱化风险,避免盐分过高对红桃树体及果实品质造成不利影响。同时,土壤pH值的监控对于调节土壤酸碱度、优化养分有效性至关重要,有助于红桃树体健康生长与果实糖度、色泽等品质的提升。综上所述,这些数据的综合应用,不仅提升了红桃种植的科学性与精准性,也为实现红桃产业的可持续发展提供了有力支持。1.数据采集:本系统通过土壤温湿度传感器、土壤PH传感器、土壤盐度传感器等物联网设备,结合4G/5G、Wi-Fi与有线网络,实时采集种植环境中的土壤温湿度、土壤PH、土壤盐度、土壤电导率等多维数据。 2.算法规则:系统采用环境参数评分算法,对环境数据进行评分。基于作物生长理想条件(如土壤温湿度、土壤PH、土壤盐度、土壤电导率等),并通过以下公式计算:环境参数评分=100-Σ(w_i×|当前值_i-理想值_i|/容差_i)其中,Σ表示对所有参数的累加,w_i是第i个参数的权重。当前值_i是第i个参数的实际测量值,理想值_i是第i个参数的理想值。容差_i是第i个参数的允许波动范围。权重、理想值和容差范围设定基于历史数据分析以及实际种植经验的确定。对作物生长影响较大的参数获得较高的权重。容差范围则考虑到环境因素的波动性,针对作物对不同环境变化的耐受性设定进行适当设定,环境参数偏离理想值越多,扣分越大,以土壤湿度为例,其权重为3,理想值设定为65%RH,容差范围为±5%RH,扣分计算如下:土壤湿度扣分=3×|22.7-65|/5=3×8.46=25.38。根据这些评分生成具体的环境优化方案。
Collecting data such as soil temperature and humidity, soil salinity, soil pH, and soil electrical conductivity in red peach cultivation plays a critical role in refined orchard management, optimization of growing environments, and improvement of fruit quality. These data provide real-time feedback on soil health status for growers, enabling them to precisely regulate irrigation amounts, fertilization plans, and soil improvement measures. By monitoring soil moisture and temperature, growers can adjust irrigation plans in a timely manner to ensure that the root systems of red peach trees are in a suitable moisture environment, promoting nutrient absorption and fruit development. The measurement of soil salinity and electrical conductivity helps identify soil salinization risks, preventing adverse impacts of excessive salt on red peach tree growth and fruit quality. Meanwhile, monitoring soil pH is critical for regulating soil acidity and alkalinity and optimizing nutrient availability, which contributes to the healthy growth of red peach trees and the improvement of fruit quality indicators such as sugar content and color. In summary, the comprehensive application of these data not only enhances the scientificity and precision of red peach cultivation but also provides strong support for the sustainable development of the red peach industry. 1. Data Collection: This system collects multi-dimensional data including soil temperature and humidity, soil pH, soil salinity, and soil electrical conductivity in the planting environment in real time, using IoT devices such as soil temperature and humidity sensors, soil pH sensors, and soil salinity sensors, combined with 4G/5G, Wi-Fi, and wired networks. 2. Algorithm Rules: The system uses an environmental parameter scoring algorithm to score environmental data. Based on the ideal conditions for crop growth (such as soil temperature and humidity, soil pH, soil salinity, and soil electrical conductivity), the score is calculated using the following formula: Environmental Parameter Score = 100 - Σ(w_i × |Current Value_i - Ideal Value_i| / Tolerance_i). Where Σ represents the summation of all parameters, w_i is the weight of the i-th parameter, Current Value_i is the actual measured value of the i-th parameter, Ideal Value_i is the ideal value of the i-th parameter, and Tolerance_i is the allowable fluctuation range of the i-th parameter. The weights, ideal values, and tolerance ranges are determined based on historical data analysis and actual planting experience. Parameters that have a greater impact on crop growth are assigned higher weights. The tolerance ranges are appropriately set considering the volatility of environmental factors and the crop's tolerance to different environmental changes. The more the environmental parameters deviate from the ideal values, the greater the score deduction. Taking soil moisture as an example, its weight is 3, the ideal value is set to 65% RH, and the tolerance range is ±5% RH. The score deduction for soil moisture is calculated as follows: Soil Moisture Deduction = 3 × |22.7 - 65| / 5 = 3 × 8.46 = 25.38. Specific environmental optimization plans are generated based on these scores.