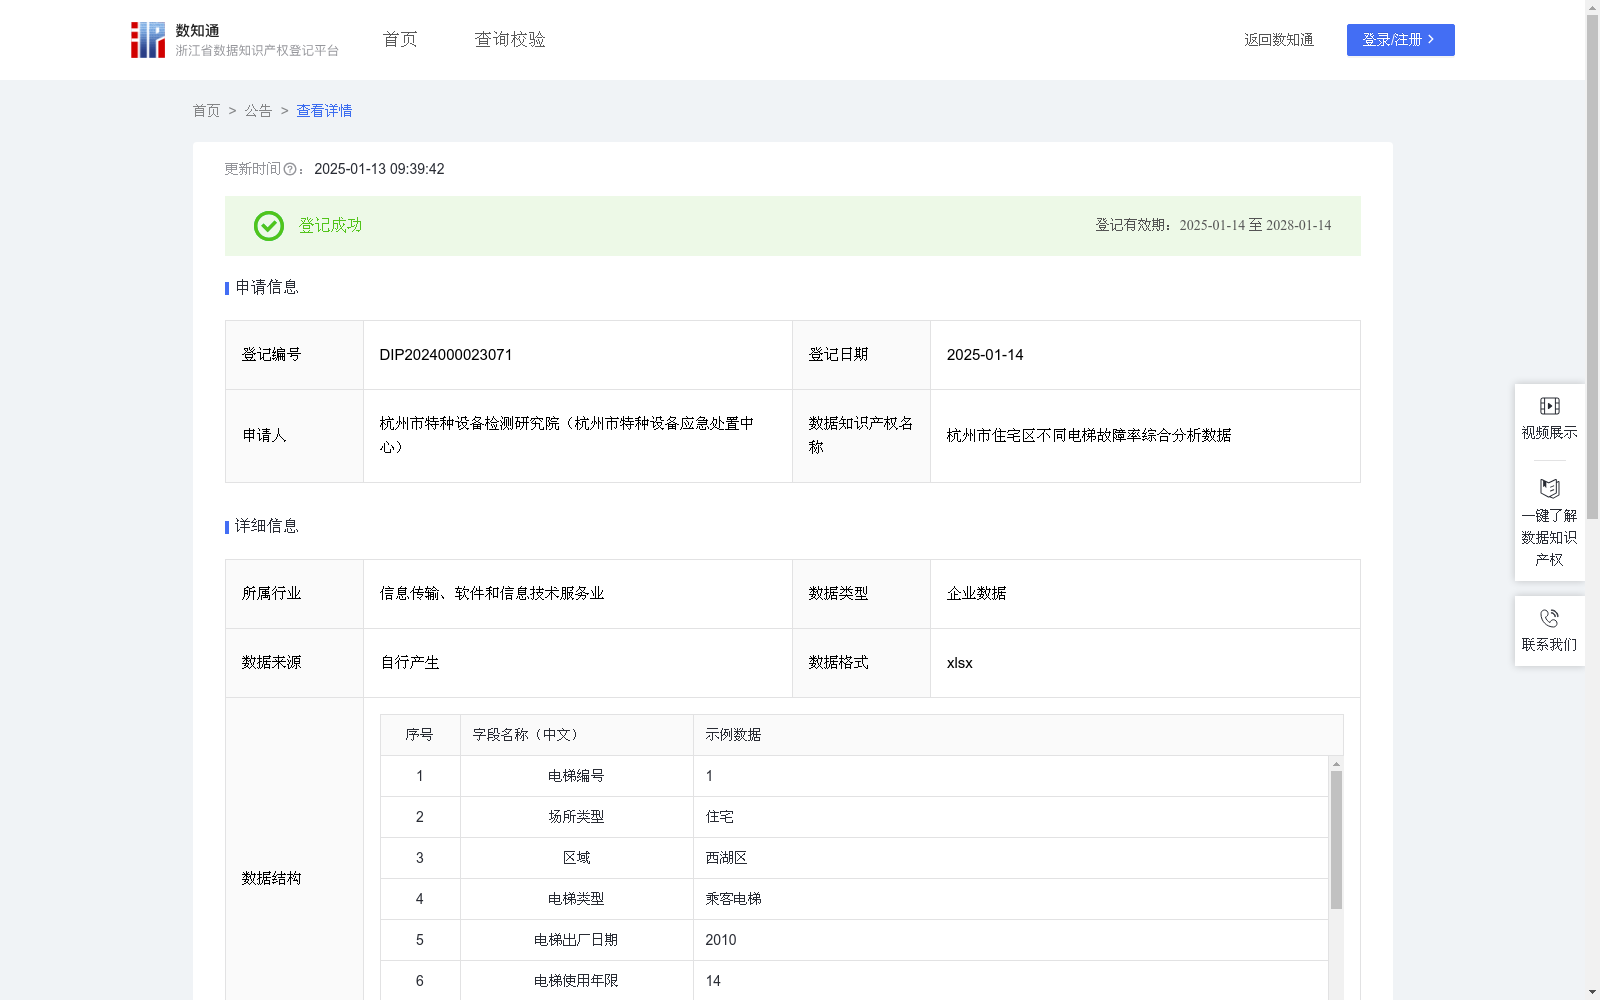
杭州市住宅区不同电梯故障率综合分析数据
收藏资源简介:
采集和统计杭州市住宅区电梯出现故障的情况,分析不同类型的电梯故障率。不同类型的电梯维保重点各不相同,本数据可应用于帮助各维保单位优化安全管理作业人员配置;加强监管,提高日常维护频率,精准加强维保内容,减少电梯安全隐患,协助政府对民生基础设施这一重要组成部分进行统筹。不同场所下电梯的种类数量各不相同,其维保重点具有差异,因此数据以不同场所分类。1、数据采集:通过电梯物联网设备和接警平台,采集杭州市住宅区电梯发生故障的情况。 2、数据处理:对采集到的原始数据进行清洗、分析、整理等方式,获取所需要的数据:电梯类型,出厂日期,使用年限,故障数量,故障名称。3.系统通过IF函数以及SUM公式进行数据计算,IF(杭州市,住宅区),满足则对机器进行编号录入,出现1次故障则数量记1,累加计算,未出现故障则记0(数量相关字段单位为次)。杭州市住宅区电梯故障总数量=∑住宅区全部序号电梯故障数量(∑为求和公式符号,非字段代称),杭州市住宅区某类型电梯故障率=杭州市住宅区某类型电梯故障数量/ 杭州市住宅区电梯故障总数量。4、数据分析:通过Finereport等软件将故障发生情况制作成可视化图表,直观反应各类型电梯的故障率,0≤故障率≤5%记为“关注维持”,5%<故障率≤100%记为“关注预警”。对“关注维持”的电梯种类继续沿用既往监管模式,对“关注预警”的电梯类型相关负责人进行示警通知,督促维保单位加强监管。(不同场所下电梯的种类数量各不相同,其维保重点具有差异,因此数据以不同场所分类:例如住宅区多客梯,商场常用扶梯等;统计日期为数据包提取进行算法应用的时间,整体时间跨度为第一台电梯投入使用至今,单纯以“某一年”进行限定与数据情况不符,因此字段名称不出现具体年份集合的限定;数据包每年更新,叠加覆盖计算构建动态大数据模型)
This dataset collects and statistically analyzes elevator failure conditions in residential areas of Hangzhou, and analyzes the failure rates of different types of elevators. Different types of elevators have distinct maintenance priorities, so this dataset can be used to help maintenance units optimize the allocation of safety management personnel, strengthen supervision, increase daily maintenance frequency, precisely adjust maintenance contents, reduce elevator safety hazards, and assist the government in overall planning of this important component of people's livelihood infrastructure. Since the types and quantities of elevators vary across different places with different maintenance priorities, the dataset is classified by different places. 1. Data Collection: Collect elevator failure data in residential areas of Hangzhou via elevator IoT devices and alarm receiving platforms. 2. Data Processing: Clean, analyze and organize the collected raw data to obtain required data fields: elevator type, manufacturing date, service life, number of failures, and failure name. 3. Data Calculation: The system uses the IF function and SUM formula for data calculation. The condition `IF(Hangzhou, Residential Area)` is set: if the condition is satisfied, the elevator is assigned a serial number for entry. Each occurrence of a failure is recorded as 1 for cumulative counting, and 0 is recorded for elevators with no failures (unit of quantity-related fields: times). The total number of elevator failures in Hangzhou residential areas = ∑ (the ∑ here refers to the summation formula symbol, not a field alias) the number of failures of all serial-numbered elevators in residential areas. The failure rate of a certain type of elevator in Hangzhou residential areas = (number of failures of this type of elevator in Hangzhou residential areas) / (total number of elevator failures in Hangzhou residential areas). 4. Data Analysis: Use software such as Finereport to create visual charts of failure occurrences, which intuitively reflect the failure rates of various types of elevators. The failure rate range 0 ≤ failure rate ≤5% is classified as "Monitor and Maintain", and 5% < failure rate ≤100% is classified as "Monitor and Alert". For elevator types categorized as "Monitor and Maintain", the existing supervision mode shall be continued; for elevator types categorized as "Monitor and Alert", the relevant responsible persons shall be notified with an alert to urge maintenance units to strengthen supervision. It is specified that the types and quantities of elevators vary across different places with different maintenance priorities, so the dataset is classified by different places: for example, residential areas mostly use passenger elevators, while shopping malls commonly use escalators. The statistical date is the time when the data package is extracted for algorithm application, and the overall time span spans from the commissioning of the first elevator to the present. Limiting the data to a "certain year" is inconsistent with the actual data situation, so the field names do not include restrictions on specific year sets. The data package is updated annually, and cumulative coverage calculation is adopted to build a dynamic big data model.