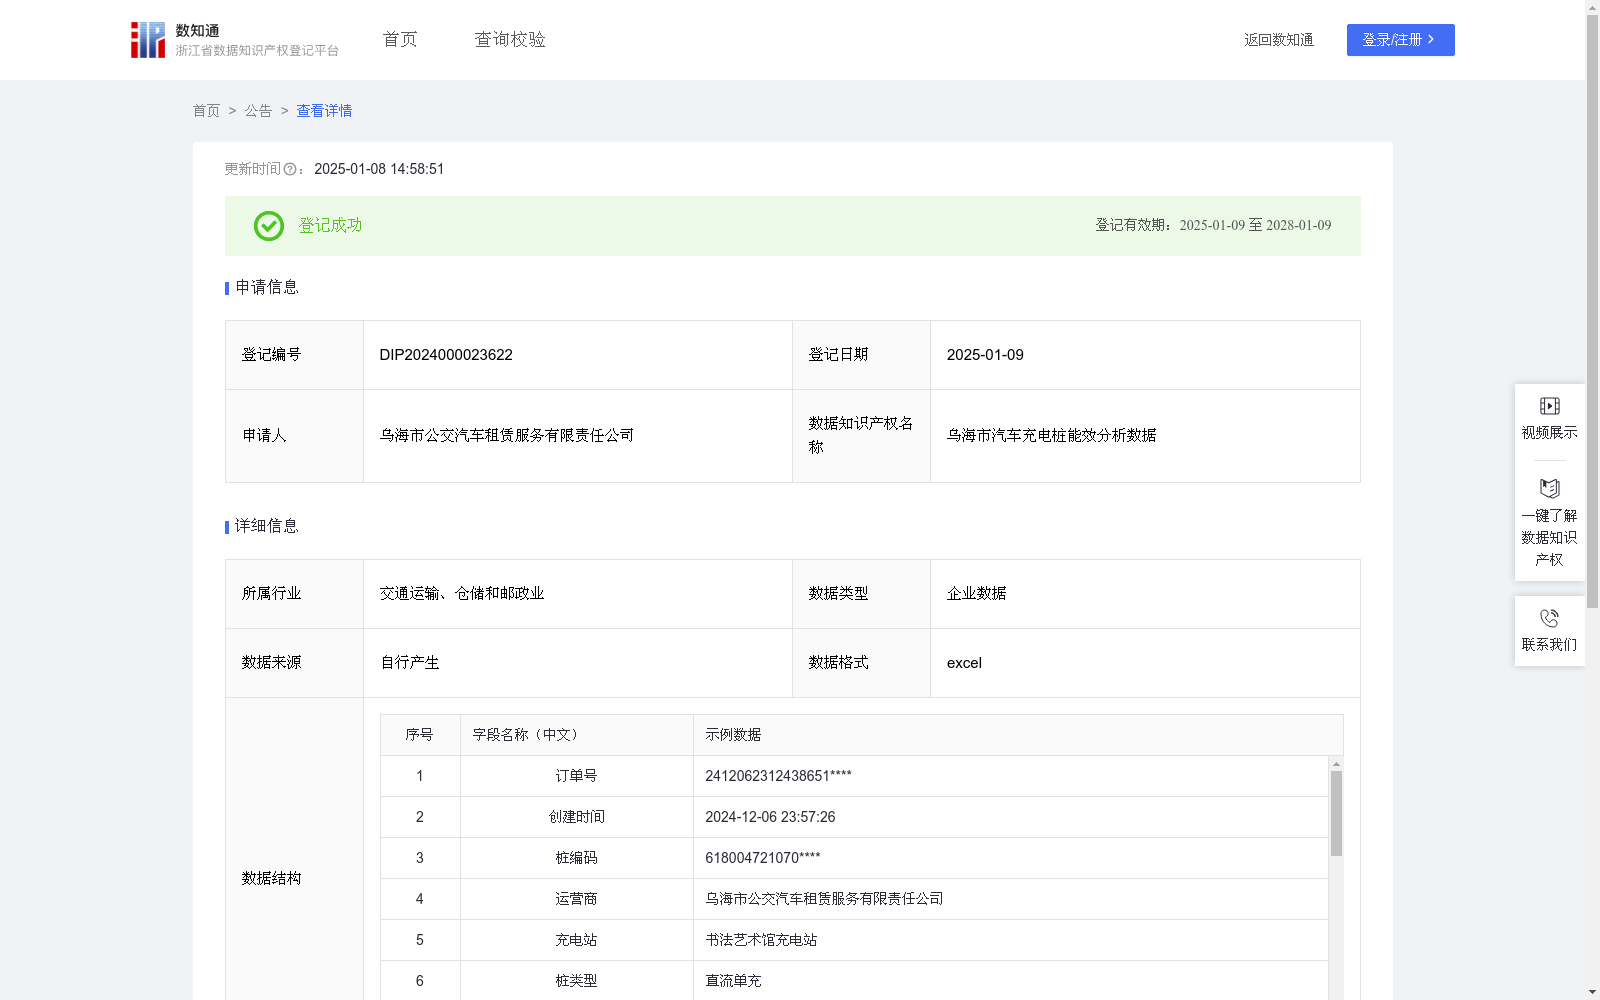
乌海市汽车充电桩能效分析数据
收藏资源简介:
汽车充电桩运营分析数据,主要通过计算单位电量充电成本和每小时充电速率两个维度,对充电桩的运营情况进行综合评估,可以用于确定充电桩的最佳充电策略,以满足不同用户的需求并优化能源利用;另一方面对于充电前后SOC变化量的数值监测,可以及时发现充电过程中的异常情况,有助于设备故障诊断和预测;此外基于历史数据,可以预测用户未来的充电行为、充电完成时间以及充电成本,为用户提供更好体验。1、数据采集:利用乌海市公共汽车租赁服务公司充电管理平台,采集乌海市各个充电站及充电桩业务数据2、数据处理:对采集到的数据进行聚合与分类,按照时间、充电站、桩类型、桩编码、订单号等关键维度进行梳理。3、数据加工:充电金额=电费+服务费;根据开始时间、结束时间,计算充电时长(小时);SOC变化量=结束SOC-开始SOC,单位电量充电成本=充电金额/充电电量;每小时充电速率= SOC变化量/充电时长(小时)。4、数据应用:若SOC变化量≤0,则记为充电异常,利用数据可视化工具,展示单位电量充电成本和每小时充电速率。
Operational analysis data for electric vehicle (EV) charging piles. This dataset conducts comprehensive evaluation of the operational status of charging piles mainly from two dimensions: charging cost per unit electricity and charging rate per hour, which can be used to determine optimal charging strategies for charging piles to meet the needs of different users and optimize energy utilization. On the other hand, monitoring the change of State of Charge (SOC) before and after charging can detect abnormalities during the charging process in a timely manner, which supports equipment fault diagnosis and prediction. In addition, based on historical data, it can predict users' future charging behaviors, charging completion time and charging costs, thereby providing a better user experience. 1. Data Collection: Business data of various charging stations and charging piles in Wuhai City is collected via the charging management platform of Wuhai City Public Bus Rental Service Company. 2. Data Processing: The collected data is aggregated and classified, and sorted out based on key dimensions including time, charging station, pile type, pile code and order number. 3. Data Calculation & Processing: Charging amount = electricity fee + service fee; Calculate charging duration (in hours) based on the start time and end time; SOC change = end SOC - start SOC; Charging cost per unit electricity = total charging amount / total charging electricity; Charging rate per hour = SOC change / charging duration (in hours). 4. Data Application: If the SOC change is ≤ 0, it is recorded as a charging abnormality; Data visualization tools are used to display the charging cost per unit electricity and the charging rate per hour.