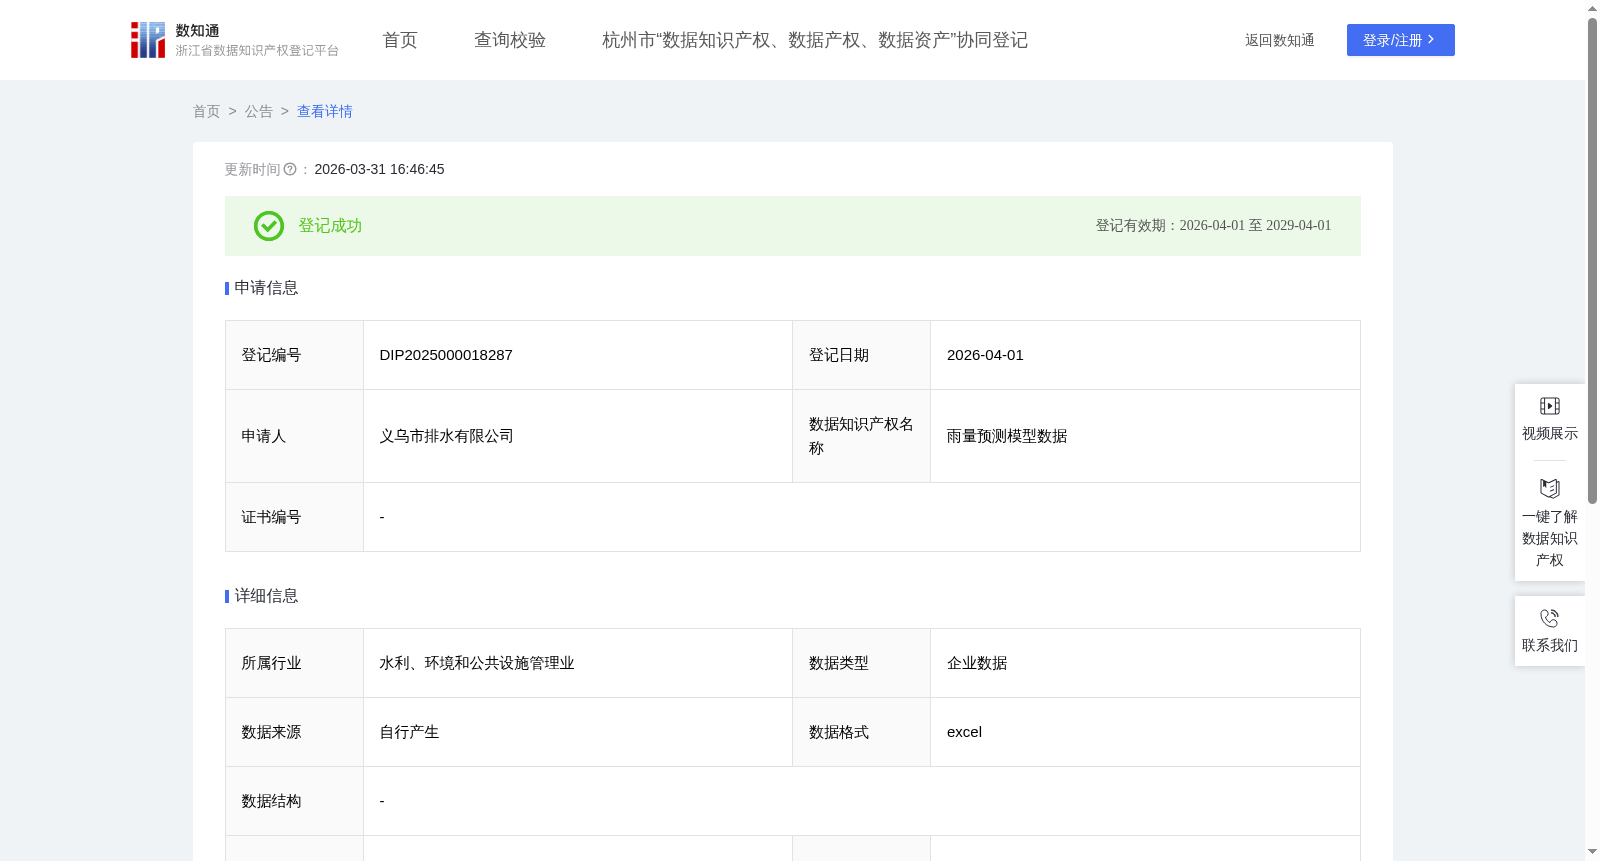
雨量预测模型数据
收藏资源简介:
依托该区域的实时雨强、最大降雨量等数据,构建区域化内涝风险预警模型。当监测到雨强达到50mm/h且呈上升趋势,或短时间内最大降雨量快速突破 100mm时,系统自动触发分级预警:一级预警(雨强≥50mm/h)时,通过社区公告、政务 APP 推送提醒,告知居民避开低洼路段;二级预警(雨强≥100mm/h)时,联动街道办、物业提前做好地下车库挡水板铺设、排水泵调试等准备,同时协调交警在易积水路口设置警示标识,避免车辆涉水遇险,切实降低降雨对居民出行安全的威胁。1、数据采集:采集近两月雨量数据,包含:序号、区域、时间等字段;2、数据处理:对采集到的数据进行分类、梳理,便于分析使用;3、算法加工:(1)模型描述:建立雨量预测模型,将整个义乌市划分成1平方公里的格子,对未来两小时进行预测,每个格子会有24个值(每5min一次,共24次);以江东污水厂为例:假设江东污水厂占10个格子,表格最大降雨量(mm/2h):每个格子24个值相加,取10个格子中最大值;表格平均降雨量(mm/2h):10个格子,每个格子都计算出2小时降雨总量,取平均值;(2)计算雨强:雨强(mm/h)=(最大降雨量(mm/2h)+平均降雨量(mm/2h))/2;(3)分级预警:一级预警(雨强≥50mm/h);二级预警(雨强≥100mm/h)。
Relying on real-time rainfall intensity, maximum rainfall and other relevant data of the target area, a regional urban waterlogging risk early warning model is constructed. When it is detected that the rainfall intensity reaches 50 mm/h and exhibits an upward trend, or the short-term maximum rainfall rapidly exceeds 100 mm, the system automatically activates graded early warnings: For Level 1 warning (rainfall intensity ≥ 50 mm/h), send push reminders via community announcements and government affairs APPs to inform residents to avoid low-lying road sections; For Level 2 warning (rainfall intensity ≥ 100 mm/h), coordinate with subdistrict offices and property management teams to make pre-emptive preparations including laying water baffles for underground garages and debugging drainage pumps, meanwhile arrange traffic police to set up warning signs at waterlogging-prone intersections to prevent vehicles from getting into trouble when wading through water, thereby effectively reducing the threat of rainfall to residents' travel safety. 1. Data Collection: Collect rainfall data from the past two months, including fields such as serial number, region, time and other related items; 2. Data Processing: Classify and organize the collected data to facilitate subsequent analysis and application; 3. Algorithm Processing: (1) Model Description: Establish a rainfall prediction model by dividing the entire Yiwu City into 1-square-kilometer grids, and conduct predictions for the next two hours. Each grid will generate 24 predicted values (once every 5 minutes, for a total of 24 times). Taking Jiangdong Sewage Treatment Plant as an example: assuming that the plant covers 10 grids, the table's maximum rainfall (mm/2h) is calculated by summing the 24 values of each grid and taking the maximum value among the 10 grids; the table's average rainfall (mm/2h) is calculated by calculating the 2-hour total rainfall for each of the 10 grids and then taking the average value; (2) Rainfall Intensity Calculation: Rainfall intensity (mm/h) = (maximum rainfall (mm/2h) + average rainfall (mm/2h)) / 2; (3) Graded Early Warning: Level 1 warning (rainfall intensity ≥ 50 mm/h); Level 2 warning (rainfall intensity ≥ 100 mm/h).