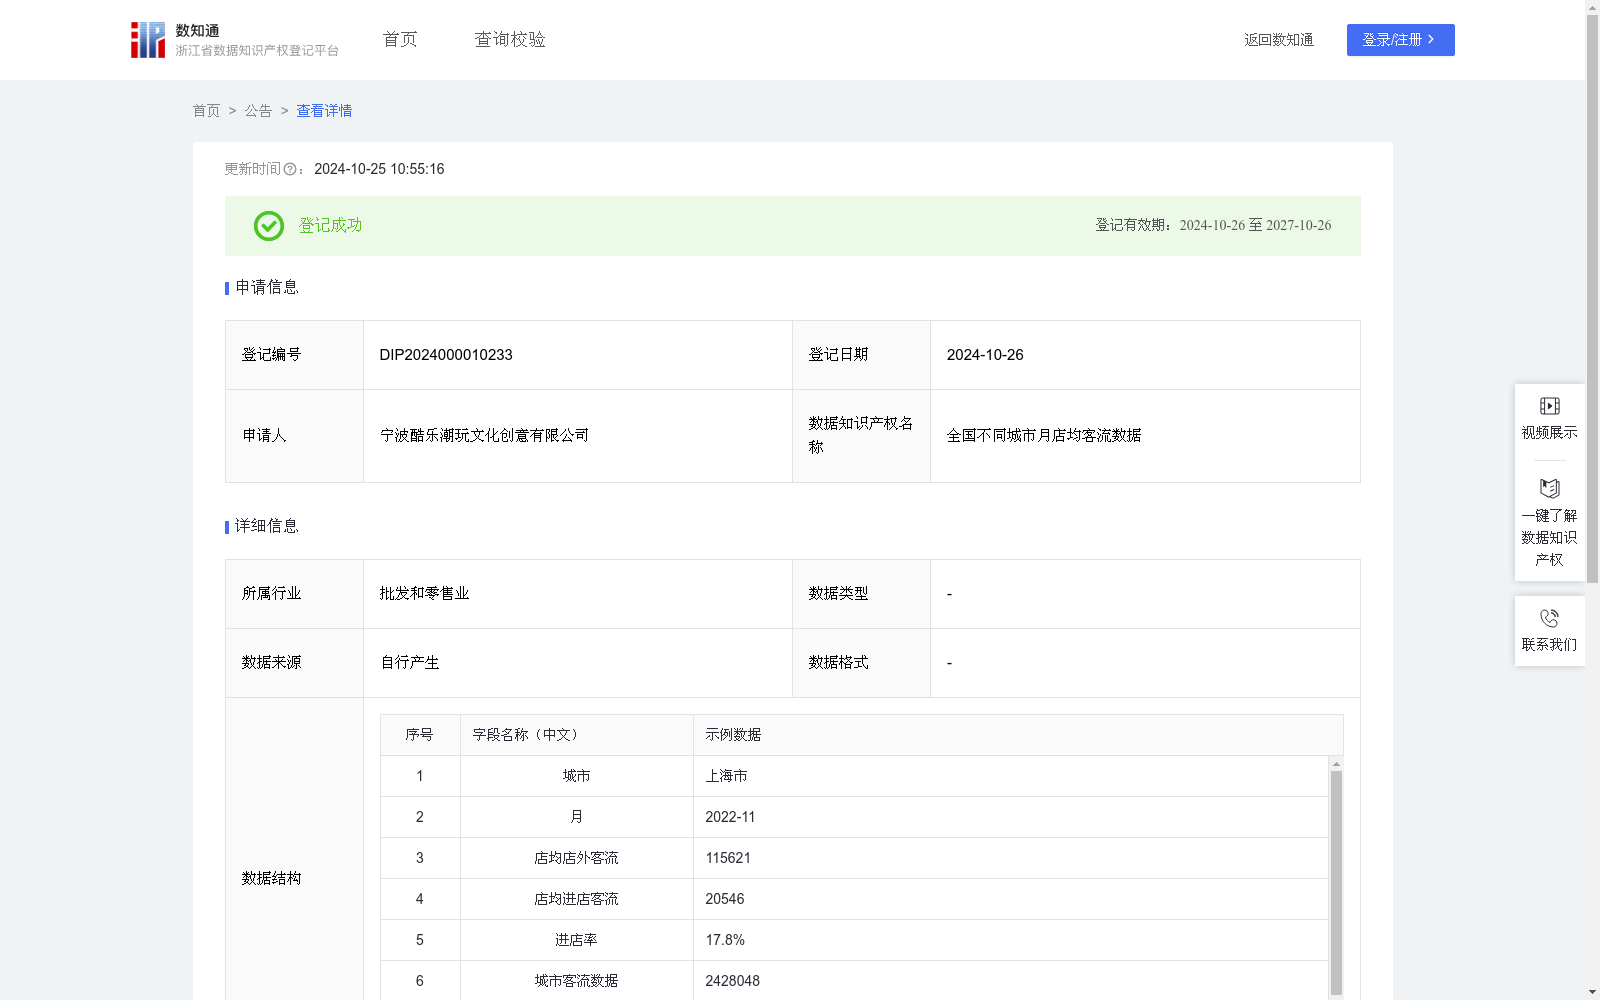
全国不同城市月店均客流数据
收藏资源简介:
1. 市场趋势分析:通过分析各城市门店的客流量变化趋势,可以洞察消费者的消费行为模式,预测未来的市场趋势,为企业的市场策略提供依据。 2. 地域性策略制定:识别哪些城市的客流量高或增长迅速,企业可针对性地在这些区域增加投入,如开设新店、加强营销活动或优化商品结构,以抓住市场机会。 3. 门店绩效评估:比较不同城市门店的客流量和进店率,可以评估各城市门店的经营状况和市场吸引力,为资源配置和绩效管理提供数据支持。一、数据抽取、清理和处理 数据抽取:从数据库抽取客流相关包括客流门店维度表等原始数据。 数据清理:对抽取的数据进行清洗,去除重复、错误或无关的信息,处理缺失值、异常值,统一数据格式。 二、数据仓库层建设 1.数据模型设计 2.中间表ETL过程:将不同客流器收集的数据,通过SQL梳理到同一个中间表中 三、基于中间表输出不同城市客流数据 1.通过中间表筛选出开足整个月的门店的客流数据,关联城市表综合计算出各城市各月的店均店外客流、进店客流和进店率。 算法规则包括: (1)店均店外客流=城市客流数据/开足整个月的门店数; (2)店均进店客流=开足整个月的门店的客流数据/开足整个月的门店数; (3)进店率=开足整个月的门店的客流数据/城市客流数据=店均进店客流/店均店外客流
1. Market Trend Analysis: By analyzing the foot traffic change trends of stores across various cities, enterprises can gain insights into consumer consumption behavior patterns, predict future market trends, and provide evidence-based support for their market strategies. 2. Regional Strategy Formulation: By identifying cities with high foot traffic or rapid foot traffic growth, enterprises can selectively increase investments in these regions, such as opening new stores, launching intensified marketing campaigns, or optimizing product assortments, to seize market opportunities. 3. Store Performance Evaluation: Comparing the foot traffic and in-store visit rates of stores across different cities enables the assessment of operational conditions and market attractiveness of stores in each city, providing data support for resource allocation and performance management. I. Data Extraction, Cleaning and Processing Data Extraction: Extract raw foot traffic-related data including store dimension tables from the database. Data Cleaning: Clean the extracted data by removing duplicate, erroneous or irrelevant information, handling missing values and outliers, and unifying data formats. II. Data Warehouse Layer Construction 1. Data Model Design 2. Intermediate Table ETL Process: Organize data collected from various foot traffic counters into a unified intermediate table using SQL. III. Output Foot Traffic Data for Different Cities Based on the Intermediate Table 1. Filter the foot traffic data of stores that have been fully operational for an entire month using the intermediate table, and associate it with the city table to comprehensively calculate the monthly average out-of-store foot traffic per store, average in-store foot traffic per store, and in-store visit rate for each city. The algorithm rules are as follows: (1) Average out-of-store foot traffic per store = City-level foot traffic data / Number of stores fully operational for the entire month; (2) Average in-store foot traffic per store = Foot traffic data of stores fully operational for the entire month / Number of stores fully operational for the entire month; (3) In-store visit rate = Foot traffic data of stores fully operational for the entire month / City-level foot traffic data = Average in-store foot traffic per store / Average out-of-store foot traffic per store