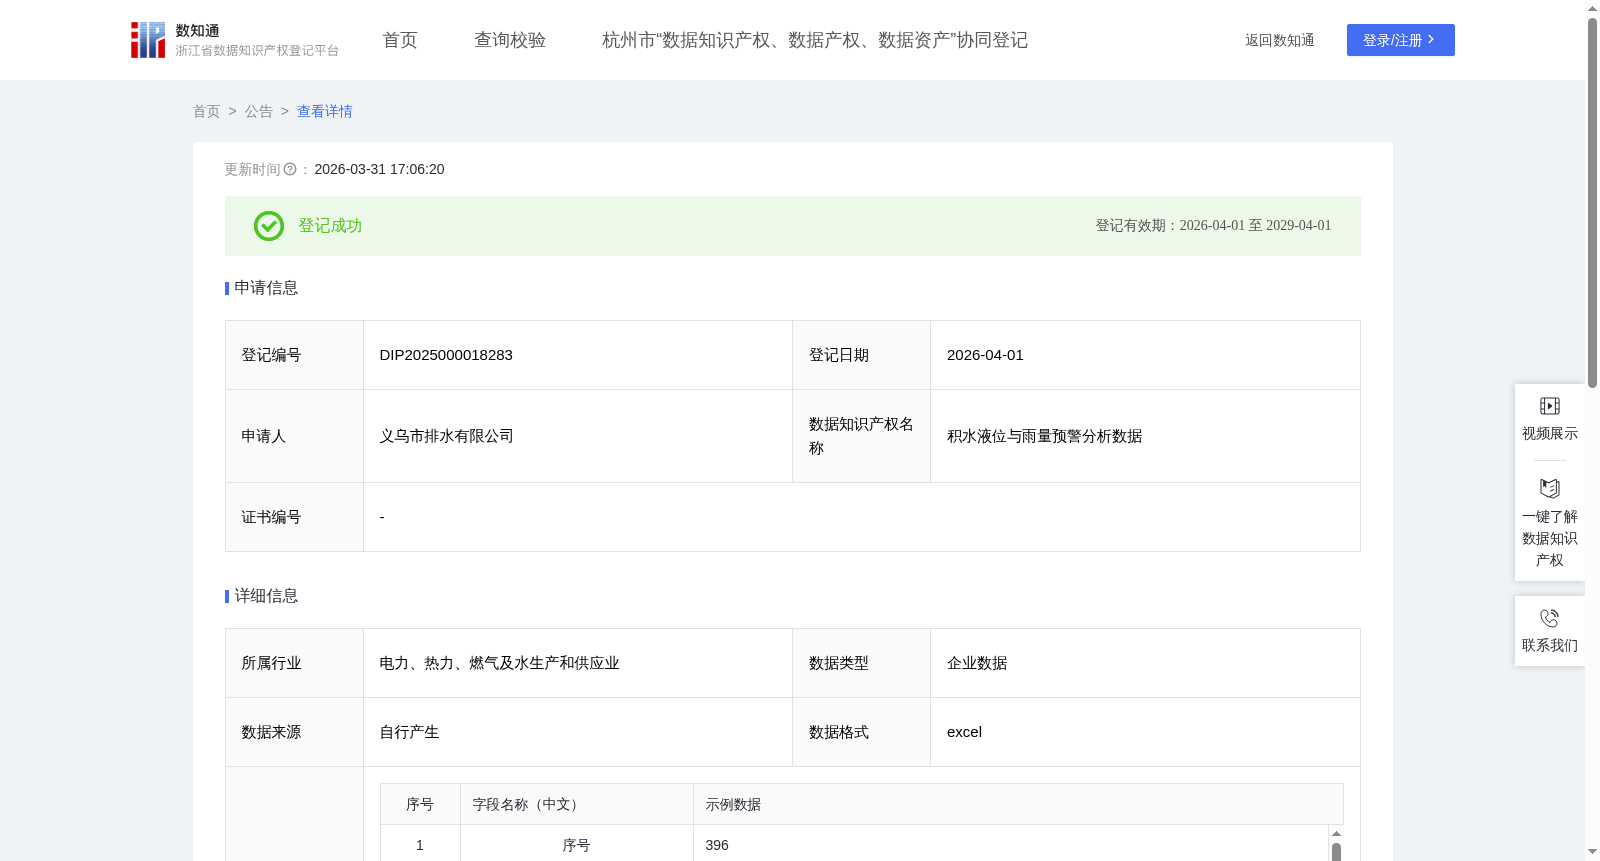
积水液位与雨量预警分析数据
收藏资源简介:
采集相邻点位之间同一时间段内的积水液位和雨量数据,通过积水液位与雨量数据的弱相关性(r=0.37),识别降雨对积水的滞后影响(如18时降雨289.2mm后积水液位达10mm),结合历史数据预测低洼路段积水风险,为应急部门提供3小时预警窗口。黄色预警:雨量超均值 2 倍(≥1.64mm/h)且积水超均值 1 倍(≥0.39mm/h),系统自动推送 “关注降雨趋势” 提醒至街道办、城管部门;橙色预警:雨量超均值 10 倍(≥8.2mm/h)且积水超均值 5 倍(≥1.95mm/h),触发 “排水设备预启动” 指令,城管排水队提前抵达现场待命;红色预警:雨量超均值 50 倍(≥41mm/h)且积水超均值 20 倍(≥7.8mm/h),立即启动 “道路临时封控 + 人员疏散” 预案,同步联动交警、消防部门。1、数据采集:采集相邻点位之间同一时间段内的积水液位和雨量数据,包含:序号、经度、纬度、id、时间段、积水液位、雨量数据等字段;2、数据处理:对采集到的数据进行分类、梳理,便于分析使用;3、算法加工:(1)数据定义:时间段:该小时内统计数据,如2024-07-01-8时,则为2024年7月1日,8:00:00-8:59:59的统计数据;数据集A:本次采集的7-8月数据为数据集A的数据统计区间;(2)使用AVERAGE函数计算数据集A的积水液位均值、雨量数据均值(保留两位小数),使用STDEV.S函数计算积水液位标准差、雨量标准差(保留两位小数),(3)根据相同经纬度信息计算相关系数r:r= Σ[(积水液位 - 积水液位均值)(雨量数据 -雨量数据均值)] / [√Σ(积水液位 - 积水液位均值)² √Σ(雨量数据 - 雨量数据均值)²],0.8≤|r|≤1.0:极强相关,0.6≤|r|≤0.8:强相关,0.4≤|r|≤0.6:中等相关,0.2≤|r|≤0.4:弱相关,|r|<0.2:极弱相关或无线性相关;(4)分类分级:黄色预警:雨量超均值 2 倍(≥1.64mm/h)且积水超均值 1 倍(≥0.39mm/h);橙色预警:雨量超均值 10 倍(≥8.2mm/h)且积水超均值 5 倍(≥1.95mm/h);红色预警:雨量超均值 50 倍(≥41mm/h)且积水超均值 20 倍(≥7.8mm/h)。
This dataset collects water logging level and rainfall data at adjacent monitoring points within the same time period. By leveraging the weak correlation (r=0.37) between water logging level and rainfall data, it identifies the lagged impact of rainfall on water accumulation (e.g., water logging level reaching 10 mm after 289.2 mm of rainfall at 18:00). Combined with historical data, it predicts water logging risks on low-lying road sections, providing a 3-hour early warning window for emergency departments. 1. Yellow early warning: When rainfall exceeds 2 times the mean (≥1.64 mm/h) and water logging level exceeds 1 times the mean (≥0.39 mm/h), the system automatically pushes a "Pay attention to rainfall trend" reminder to subdistrict offices and urban management departments. 2. Orange early warning: When rainfall exceeds 10 times the mean (≥8.2 mm/h) and water logging level exceeds 5 times the mean (≥1.95 mm/h), the "Drainage equipment pre-start" instruction is triggered, and the urban management drainage team arrives at the site in advance for standby. 3. Red early warning: When rainfall exceeds 50 times the mean (≥41 mm/h) and water logging level exceeds 20 times the mean (≥7.8 mm/h), the "Road temporary closure + personnel evacuation" plan is immediately activated, and the traffic police and fire departments are coordinated synchronously. 1. Data Collection: Collect water logging level and rainfall data at adjacent monitoring points within the same time period, including fields such as serial number, longitude, latitude, id, time period, water logging level, and rainfall data. 2. Data Processing: Classify and organize the collected data to facilitate analysis and application. 3. Algorithm Processing: (1) Data Definition: Time period: Statistical data within the current hour. For example, "2024-07-01-8" refers to the statistical data from 8:00:00 to 8:59:59 on July 1, 2024. Dataset A: The data collection interval for Dataset A is the data from July to August 2024. (2) Calculate the mean values of water logging level and rainfall data in Dataset A using the AVERAGE function, retaining two decimal places; calculate the standard deviations of water logging level and rainfall using the STDEV.S function, retaining two decimal places. (3) Calculate the correlation coefficient r based on the same longitude and latitude information: r = Σ[(water logging level - mean water logging level)(rainfall data - mean rainfall data)] / [√Σ(water logging level - mean water logging level)² * √Σ(rainfall data - mean rainfall data)²] Correlation grading criteria: 0.8 ≤ |r| ≤ 1.0: Extremely strong correlation; 0.6 ≤ |r| ≤ 0.8: Strong correlation; 0.4 ≤ |r| ≤ 0.6: Moderate correlation; 0.2 ≤ |r| ≤ 0.4: Weak correlation; |r| < 0.2: Extremely weak correlation or no linear correlation. (4) Classification and Grading: Yellow early warning: Rainfall exceeds 2 times the mean (≥1.64 mm/h) and water logging level exceeds 1 times the mean (≥0.39 mm/h); Orange early warning: Rainfall exceeds 10 times the mean (≥8.2 mm/h) and water logging level exceeds 5 times the mean (≥1.95 mm/h); Red early warning: Rainfall exceeds 50 times the mean (≥41 mm/h) and water logging level exceeds 20 times the mean (≥7.8 mm/h).