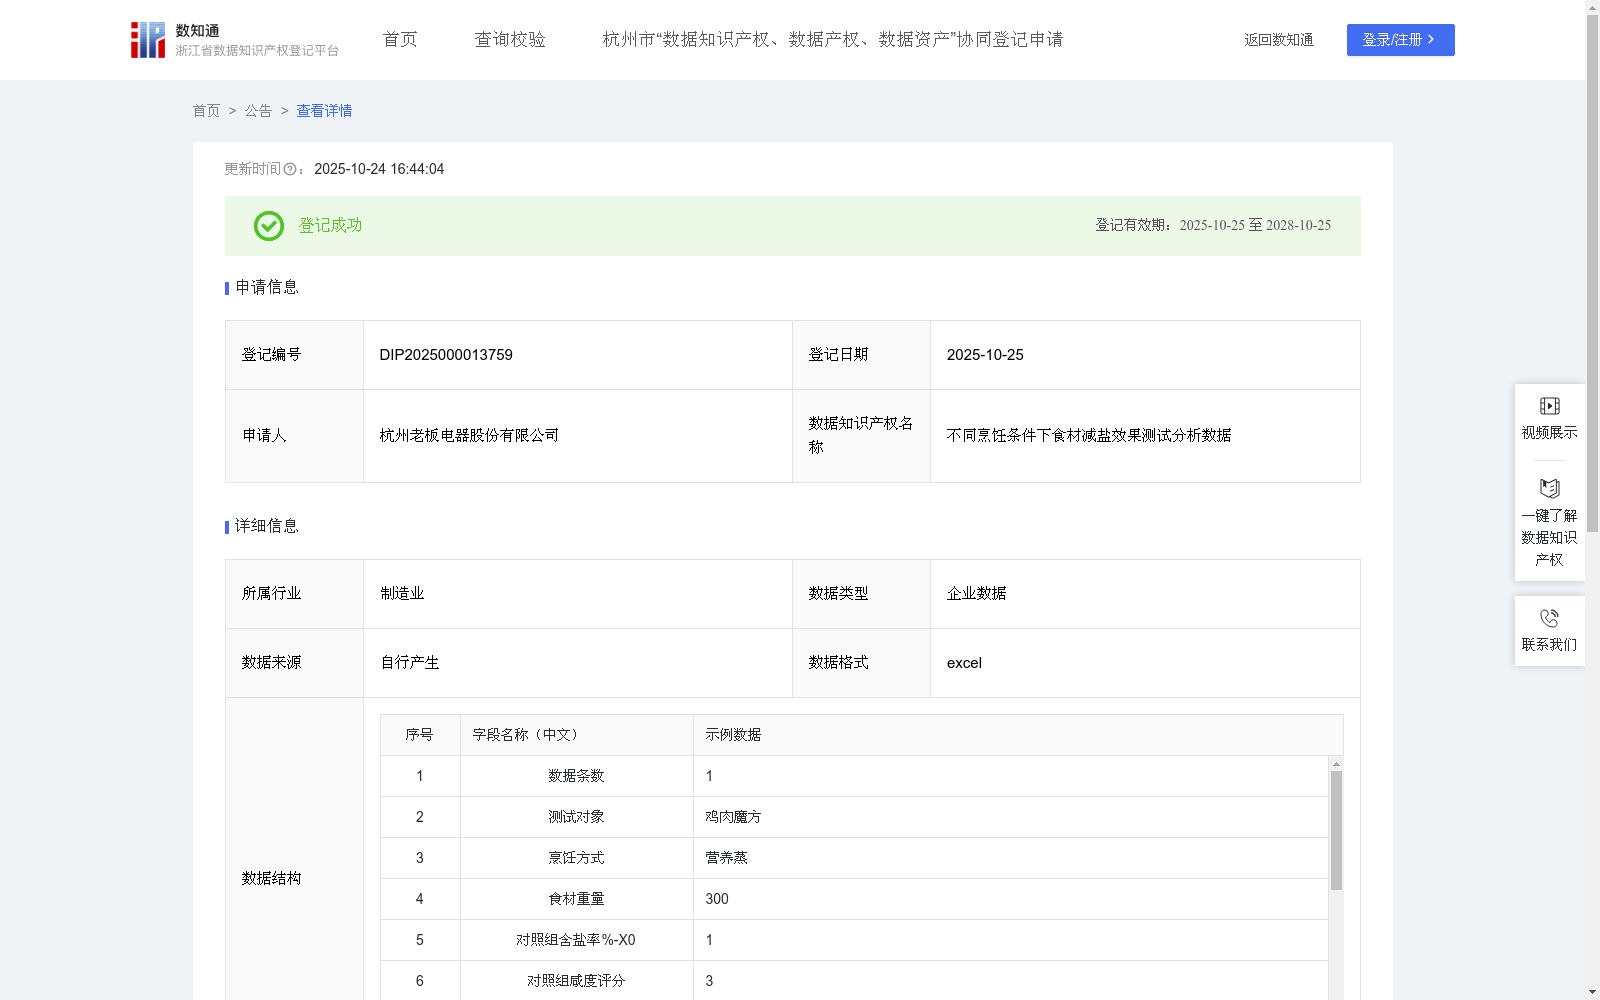
不同烹饪条件下食材减盐效果测试分析数据
收藏资源简介:
该数据可用于家电生产行业:帮助企业优化烹饪设备的功能设计,提供“减盐模式”或推荐功率设置,提升用户体验;可用于食品加工行业:本数据可以用于优化食品加工工艺,在保持咸度口感的同时降低产品含盐量,帮助食品行业可以开发出更健康、更多样化的产品,满足顾客健康饮食需求;可用于社会健康饮食研究:为健康饮食研究提供数据支撑,分析不同烹饪方式对盐摄入的影响,助力低钠饮食推广等场景。1.数据来源 记录不同测试对象(如鸡肉魔方、青椒牛柳等)、烹饪方式(如微波、营养蒸)、食材重量(固定重量300g)、对照组含盐率%-X0、对照组咸度评分、实验组含盐率%-X1,微波功率(W)P、实验组咸度评分、减盐率%等数据。 2.数据处理 减盐率计算:减盐率(%)=(X0−X1/X0)×100%,其中,X0为对照组含盐率,X1为实验组含盐率。 咸度结果判定:若实验组与对照组咸度评分无显著差异,即最接近对照组咸度(如鸡肉魔方在微波功率 300W、含盐率 0.85% 时咸度评分为 2.9,最接近对照组 3 分),则接受该减盐率,并判定为差异组;否则需进一步调整参数。 微波功率与减盐率线性:针对不同的食材(如青椒牛柳),筛选实验组与对照组咸度评分判定结果无差异的数据,将X微波功率作为自变量,Y减盐率为因变量,进行线性回归得到相应的线性模型,例如青椒牛柳得到线性模型y = 0.0576x - 0.6667,该模型微波功率与减盐率呈线性正相关,决定系数 R2=0.9802,说明模型拟合度高。 3.数据分析 通过不同食材(如青椒牛柳)的实验数据验证模型普适性,实现微波功率对减盐率的定量调控,通过上述数据可分析相同食材在不同减盐梯度下的最佳功率选择,以及不同食材对微波减盐的敏感性差异等。
This dataset can be applied in multiple scenarios: 1. Home Appliance Manufacturing Industry: Help enterprises optimize the functional design of cooking appliances, provide "low-salt mode" or recommend power settings, and improve user experience. 2. Food Processing Industry: This dataset can be used to optimize food processing technologies, reduce product salt content while maintaining saltiness and taste, assist the food industry in developing healthier and more diversified products to meet consumers' healthy diet demands. 3. Social Healthy Diet Research: Provide data support for healthy diet research, analyze the impact of different cooking methods on salt intake, and promote the popularization of low-sodium diets and other related scenarios. 1. Data Sources Record data including different test subjects (e.g., chicken cubes, green pepper and beef stir-fry, etc.), cooking methods (e.g., microwave cooking, nutritional steaming), food ingredient weight (fixed at 300g), control group salt content % - X0, control group saltiness score, experimental group salt content % - X1, microwave power (W) P, experimental group saltiness score, salt reduction rate %, etc. 2. Data Processing Salt reduction rate calculation: Salt reduction rate (%) = [(X0 - X1)/X0] × 100%, where X0 is the salt content of the control group, and X1 is the salt content of the experimental group. Salty taste result judgment: If there is no significant difference in saltiness scores between the experimental group and the control group, that is, the saltiness is closest to that of the control group (for example, the saltiness score of chicken cubes is 2.9 when the microwave power is 300W and the salt content is 0.85%, which is the closest to the control group's 3 points), then this salt reduction rate is accepted and the group is classified as a non-significant difference group; otherwise, parameters need to be adjusted further. Linear correlation between microwave power and salt reduction rate: For different food ingredients (e.g., green pepper and beef stir-fry), screen the data where the saltiness score judgment results of the experimental group and the control group show no significant difference. Take microwave power as the independent variable and salt reduction rate as the dependent variable to conduct linear regression and obtain the corresponding linear model. For example, the linear model for green pepper and beef stir-fry is y = 0.0576x - 0.6667. This model shows a linear positive correlation between microwave power and salt reduction rate, with a determination coefficient R2=0.9802, indicating a high model fitting degree. 3. Data Analysis Verify the universality of the model using the experimental data of different food ingredients (e.g., green pepper and beef stir-fry), realize quantitative regulation of salt reduction rate via microwave power, analyze the optimal power selection for the same food ingredient under different salt reduction gradients, as well as the differences in the sensitivity of different food ingredients to microwave-induced salt reduction, and other related scenarios through the above dataset.