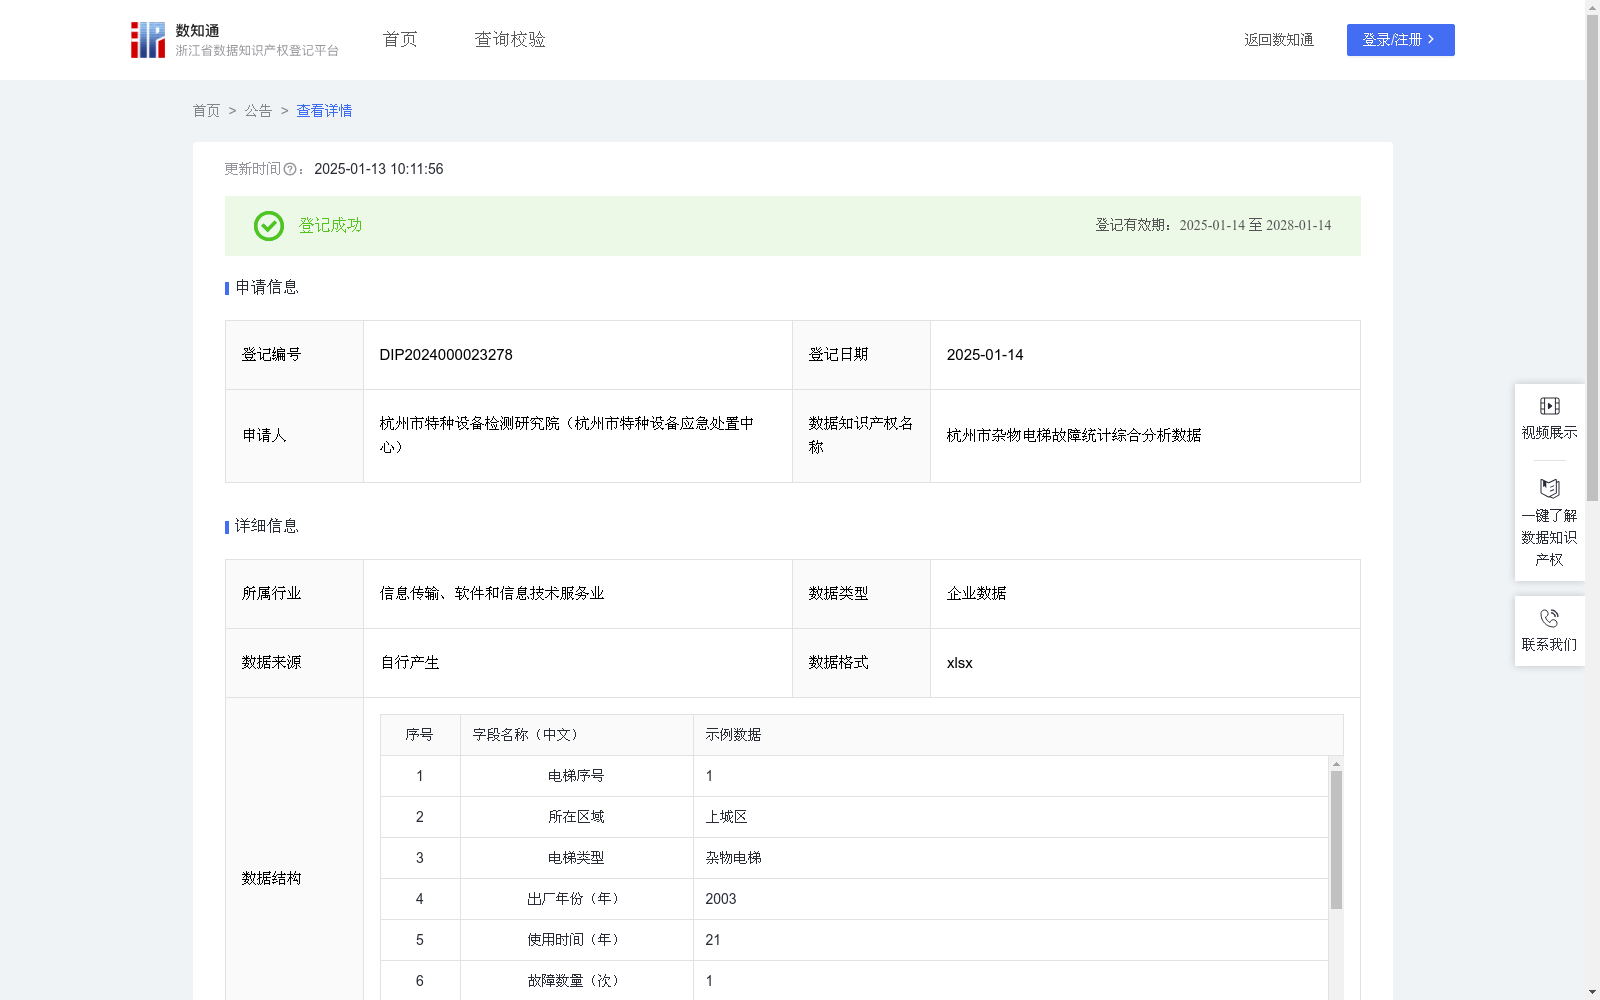
杭州市杂物电梯故障统计综合分析数据
收藏浙江省数据知识产权登记平台2025-01-13 更新2025-01-14 收录
下载链接:
https://www.zjip.org.cn/home/announce/trends/110959
下载链接
链接失效反馈官方服务:
资源简介:
采集和统计杭州市杂物电梯运行情况,分析故障类型、数量、计算故障数量占比前三的区域及原因,帮助从事电梯日常管理的单位优化安全管理作业人员配置,进行重点监管,提高日常维护频率和内容,减少电梯安全隐患,指导电梯生产,日常维护运行等全方面,同时协助政府对民生基础设施这一重要组成部分进行统筹。(不同类型的电梯具有专用性,其质量标准也具有差异,因此对故障类型的研究分成不同电梯种类进行)1、数据采集:以单一类型电梯为标准,通过电梯物联网设备和接警平台,采杭州市各区域运行至今的杂物电梯,共计发生故障的次数和故障类型。2、数据处理:对采集到的原始数据进行清洗、分析、整理等方式,获取所需要的数据:电梯所在区域、故障原因等;根据对故障的检修和智能分析,将故障原因进行分类;系统后台通过IF分类条件、SUM函数对故障数量和故障类型进行统计,算法过程为:IF(杭州市,杂物电梯)—录入编号—触发故障则数量记1,累加记录,未触发故障,则数量记0;杭州市杂物电梯故障总数=∑全区域全部序号杂物电梯故障数量(∑为求和公式符号,非字段代称)。系统进行分类归纳运算排序,直接输出故障数量排名前三的区域,认定为易发生故障区域;直接输出故障数量排名前三的原因,认定为重点监测问题,后续对其进行重点处理。3、数据分析:通过软件将电梯故障综合分析记录制作成多维度宽领域的可视化区域地图,直观反应电梯各类型故障发生的次数、区域、原因以及是否是易发生故障,指导当地电梯维修企业合理调整电梯零件采购和重点监管。(人为原因由于相关保密规定,在数据包内不做具体描述;不同类型的电梯具有专用性,其质量标准也具有差异,因此对故障类型的研究分成不同电梯种类进行;统计日期为数据包提取进行算法应用的时间,整体数据时间跨度为电梯投入使用至今,因此字段名称不出现具体年份集合的限定,例如:字段为“故障数量排名前三的区域”,因时间跨度为第一台设备投入使用至今,故不命名为“2024年故障数量排名前三的区域”,以年为周期更新计算,构建动态地图)
This dataset collects and statistically analyzes the operation status of dumbwaiter elevators in Hangzhou City, including fault types and quantities, calculates the top three regions with the highest fault occurrence proportion and their corresponding fault causes, aiming to help elevator daily management units optimize the allocation of safety management personnel, carry out targeted supervision, adjust daily maintenance frequency and content, reduce elevator safety hazards, and guide all aspects including elevator production and daily maintenance operations. Meanwhile, it assists the government in overall planning of this important part of people's livelihood infrastructure. (Note: Different types of elevators have specificity and different quality standards, so the research on fault types is conducted by classifying elevator categories.)
1. Data Collection: Taking a single type of elevator as the standard, use elevator IoT devices and alarm receiving platforms to collect the number of faults and fault types of dumbwaiter elevators that have been in operation in various regions of Hangzhou City to date.
2. Data Processing: Clean, analyze and organize the collected raw data to obtain required information including the region where the elevator is located and fault causes. Classify the fault causes based on maintenance and intelligent analysis of faults. The system background uses IF conditional statements and the SUM function to count the number and types of faults. The algorithm process is as follows: IF (Hangzhou, dumbwaiter elevator) — enter the serial number — if a fault is triggered, the quantity is recorded as 1 and accumulated; if no fault is triggered, the quantity is recorded as 0. The total number of faults of dumbwaiter elevators in Hangzhou = ∑(the fault quantities of all serial-numbered dumbwaiter elevators in all regions) (Note: ∑ here is the summation formula symbol, not a field alias). The system performs classification, induction, operation and sorting, directly outputs the top three regions with the highest fault quantities as high-fault regions, and directly outputs the top three fault causes with the highest quantities as key monitoring issues for subsequent targeted processing.
3. Data Analysis: Use software to create a multi-dimensional and wide-coverage visualized regional map of elevator fault comprehensive analysis records, which intuitively reflects the number of various types of elevator faults, their regions, causes and whether they are high-fault areas, guiding local elevator maintenance enterprises to reasonably adjust elevator parts procurement and carry out key supervision. (Human-related fault causes will not be specifically described in the data package due to relevant confidentiality regulations; different types of elevators have specificity and different quality standards, so the research on fault types is conducted by classifying elevator categories; the statistical date is the time when the data package is extracted for algorithm application, and the overall data time span is from the commissioning of the elevators to the present. Therefore, the field names do not include specific year sets, for example, the field "top three regions with the highest fault quantities" is not named "top three regions with the highest fault quantities in 2024" since the time span is from the commissioning of the first device to the present. The calculation is updated annually to build a dynamic map.)
提供机构:
杭州市特种设备检验科学研究院(杭州市特种设备应急处置中心)
创建时间:
2024-12-15
搜集汇总
数据集介绍
特点
该数据集包含杭州市杂物电梯的故障统计信息,涵盖多个关键字段如故障数量、原因及区域分布,旨在帮助优化电梯安全管理和维护策略。数据规模为539条,每年更新一次。
以上内容由遇见数据集搜集并总结生成


