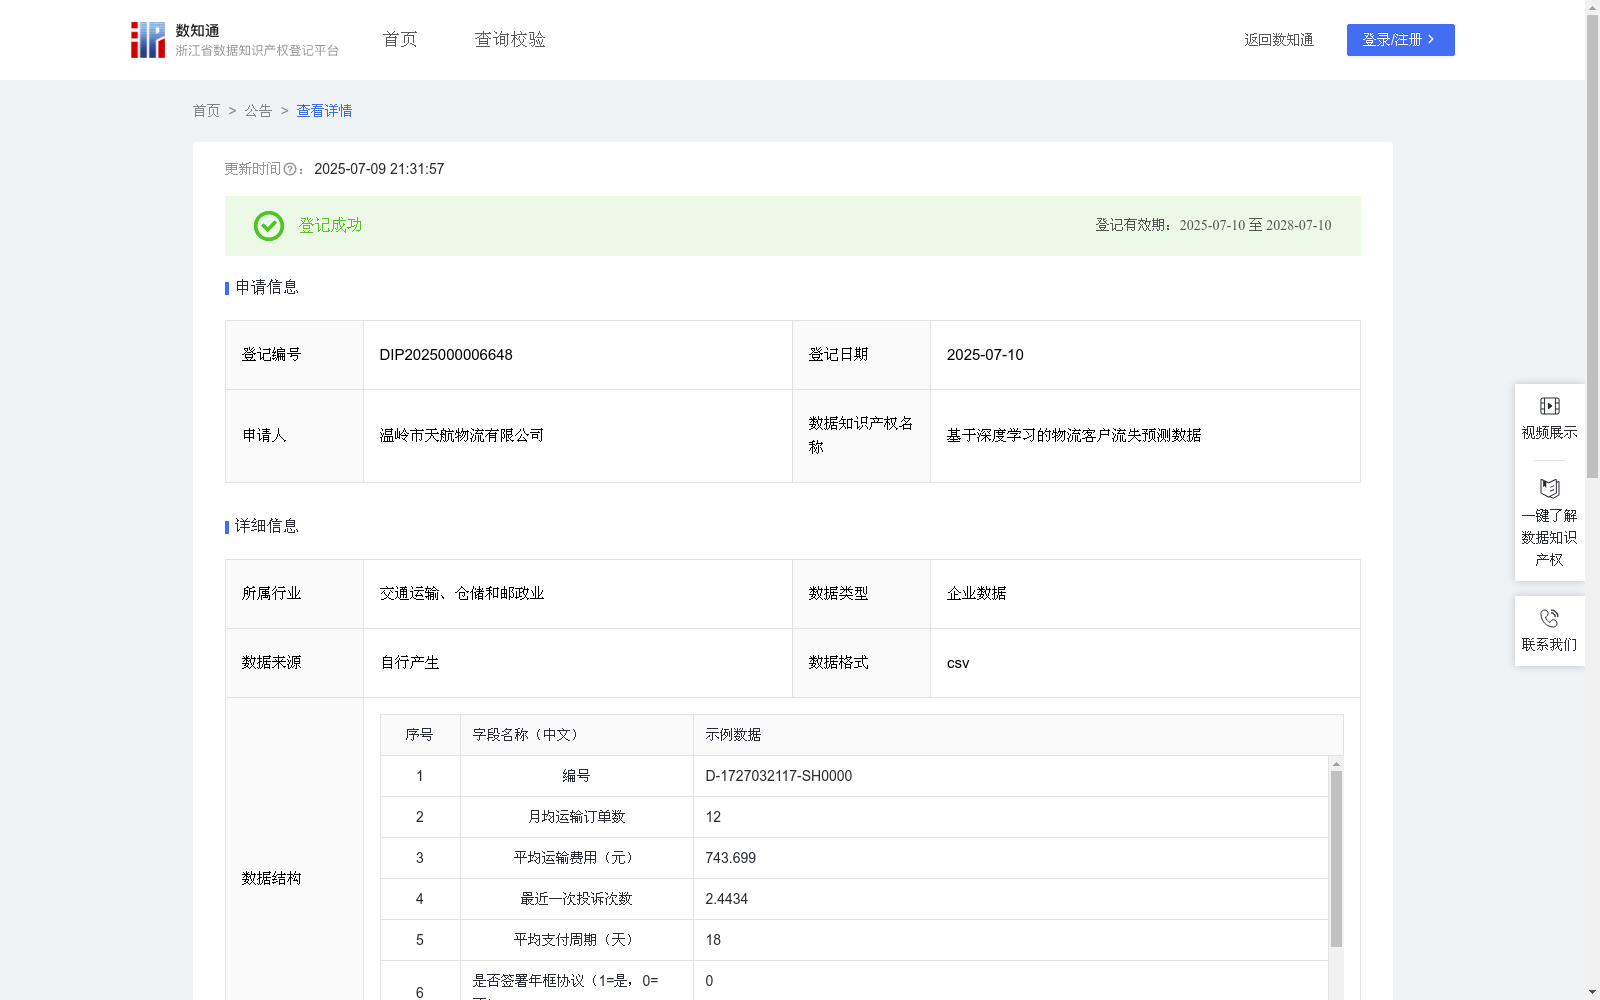
基于深度学习的物流客户流失预测数据
收藏浙江省数据知识产权登记平台2025-07-09 更新2025-07-10 收录
下载链接:
https://www.zjip.org.cn/home/announce/trends/146854
下载链接
链接失效反馈官方服务:
资源简介:
基于深度学习技术在物流客户流失分析中具有重要的应用价值。能够提供客户行为趋势分析,更精确地预测潜在流失客户,帮助运营管理人员进行风险客户识别与挽留策略制定。这项技术在物流服务过程中具有广泛的应用场景,特别是客户活跃度监测、续签意愿分析和长期合作意向评估,能够提高客户留存率,降低运营损失风险,提供智能化客户服务支持。数据收集:
在该算法中,数据来源主要包括客户使用物流平台所产生的订单数据、财务数据和客服互动记录等。具体字段如下:
编号用于标识每一位客户;
月均运输订单数来自运输订单系统,表示近6个月的订单平均值;
平均运输费用来自结算系统,表示每月的平均支出;
最近一次投诉次数源于客户服务系统的工单记录;
平均支付周期来自财务结算数据,表示回款平均周期;
是否签署年框协议通过CRM客户关系系统确认;
客户服务互动频次指近一个月的人工客服或在线服务使用次数;
是否流失作为监督学习的目标标签,根据客户近3个月是否产生任何运输订单标记;
预测流失概率为模型输出的概率结果。
数据预处理:
为提升模型预测效果,对原始结构化数据进行如下处理:
连续型数值字段(如订单数、费用、支付周期)进行标准化处理(减均值除以标准差);
类别变量(如是否签署年框协议)进行独热编码;
对缺失数据使用均值插补或中位数替换;
最终生成标准化向量数据作为神经网络输入。
模型构建:
使用一个多层感知机(MLP)模型对客户是否流失进行预测。该模型包括输入层、两个全连接隐藏层(ReLU激活)及Sigmoid输出层,用于二分类任务。
模型的主要计算公式如下:
h1 = ReLU(W1 * x + b1);
h2 = ReLU(W2 * h1 + b2);
ŷ = Sigmoid(W3 * h2 + b3);
其中:x 为标准化后的输入特征向量,包含字段:月均运输订单数、平均运输费用、最近一次投诉次数、平均支付周期、是否签署年框协议、客户服务互动频次。W1、W2、W3 为权重矩阵,b1、b2、b3 为偏置向量。h1、h2 为隐藏层的激活值。ŷ 为预测结果,即预测流失概率(对应字段“预测流失概率”)。该模型的目标是最小化二元交叉熵损失函数,优化预测客户流失的准确率。模型最终评估使用准确率、召回率和AUC曲线等指标,以衡量实际业务中对流失客户的识别能力。
Deep learning technology holds significant application value in logistics customer churn analysis. It enables trend analysis of customer behavior, more accurate prediction of potential customers at risk of churning, and assists operations managers in identifying high-risk customers and formulating retention strategies. This technology has a wide range of application scenarios in logistics service processes, especially in customer activity monitoring, renewal intention analysis and long-term cooperation intention assessment. It can improve customer retention rate, reduce the risk of operational losses, and provide intelligent customer service support.
Data Collection:
In this algorithm, the data sources mainly include order data, financial data and customer service interaction records generated by customers when using the logistics platform. The specific fields are as follows:
1. ID: used to identify each customer;
2. Average monthly number of transportation orders: from the transportation order system, representing the average number of orders over the past 6 months;
3. Average transportation cost: from the settlement system, representing the monthly average expenditure;
4. Number of latest complaints: derived from the work order records of the customer service system;
5. Average payment cycle: from financial settlement data, representing the average collection cycle;
6. Whether to sign the annual framework agreement: confirmed via the CRM (Customer Relationship Management) system;
7. Customer service interaction frequency: refers to the number of times of using manual customer service or online services in the past month;
8. Churn status: as the target label for supervised learning, marked based on whether the customer has generated any transportation orders in the past 3 months;
9. Predicted churn probability: the probability output by the model.
Data Preprocessing:
To improve the prediction performance of the model, the following processing is performed on the original structured data:
- Continuous numerical fields (such as order quantity, cost, payment cycle): standardized (subtract the mean and divide by the standard deviation);
- Categorical variables (such as whether to sign the annual framework agreement): one-hot encoding;
- Missing data: imputed with mean or replaced with median;
Finally, standardized vector data is generated as the input of the neural network.
Model Construction:
A Multi-Layer Perceptron (MLP) model is used to predict customer churn. The model includes an input layer, two fully connected hidden layers (activated by ReLU) and a Sigmoid output layer for binary classification tasks.
The main calculation formulas of the model are as follows:
h1 = ReLU(W1 * x + b1);
h2 = ReLU(W2 * h1 + b2);
ŷ = Sigmoid(W3 * h2 + b3);
Where: x is the standardized input feature vector, including the fields: average monthly number of transportation orders, average transportation cost, number of latest complaints, average payment cycle, whether to sign the annual framework agreement, and customer service interaction frequency. W1, W2, W3 are weight matrices, and b1, b2, b3 are bias vectors. h1 and h2 are the activation values of the hidden layers. ŷ is the prediction result, namely the predicted churn probability (corresponding to the field 'Predicted churn probability'). The goal of this model is to minimize the binary cross-entropy loss function and optimize the accuracy of predicting customer churn. The final evaluation of the model uses indicators such as accuracy, recall rate and AUC curve to measure the ability to identify churned customers in actual business.
提供机构:
温岭市天航物流有限公司
创建时间:
2025-05-30
搜集汇总
数据集介绍
以上内容由遇见数据集搜集并总结生成


