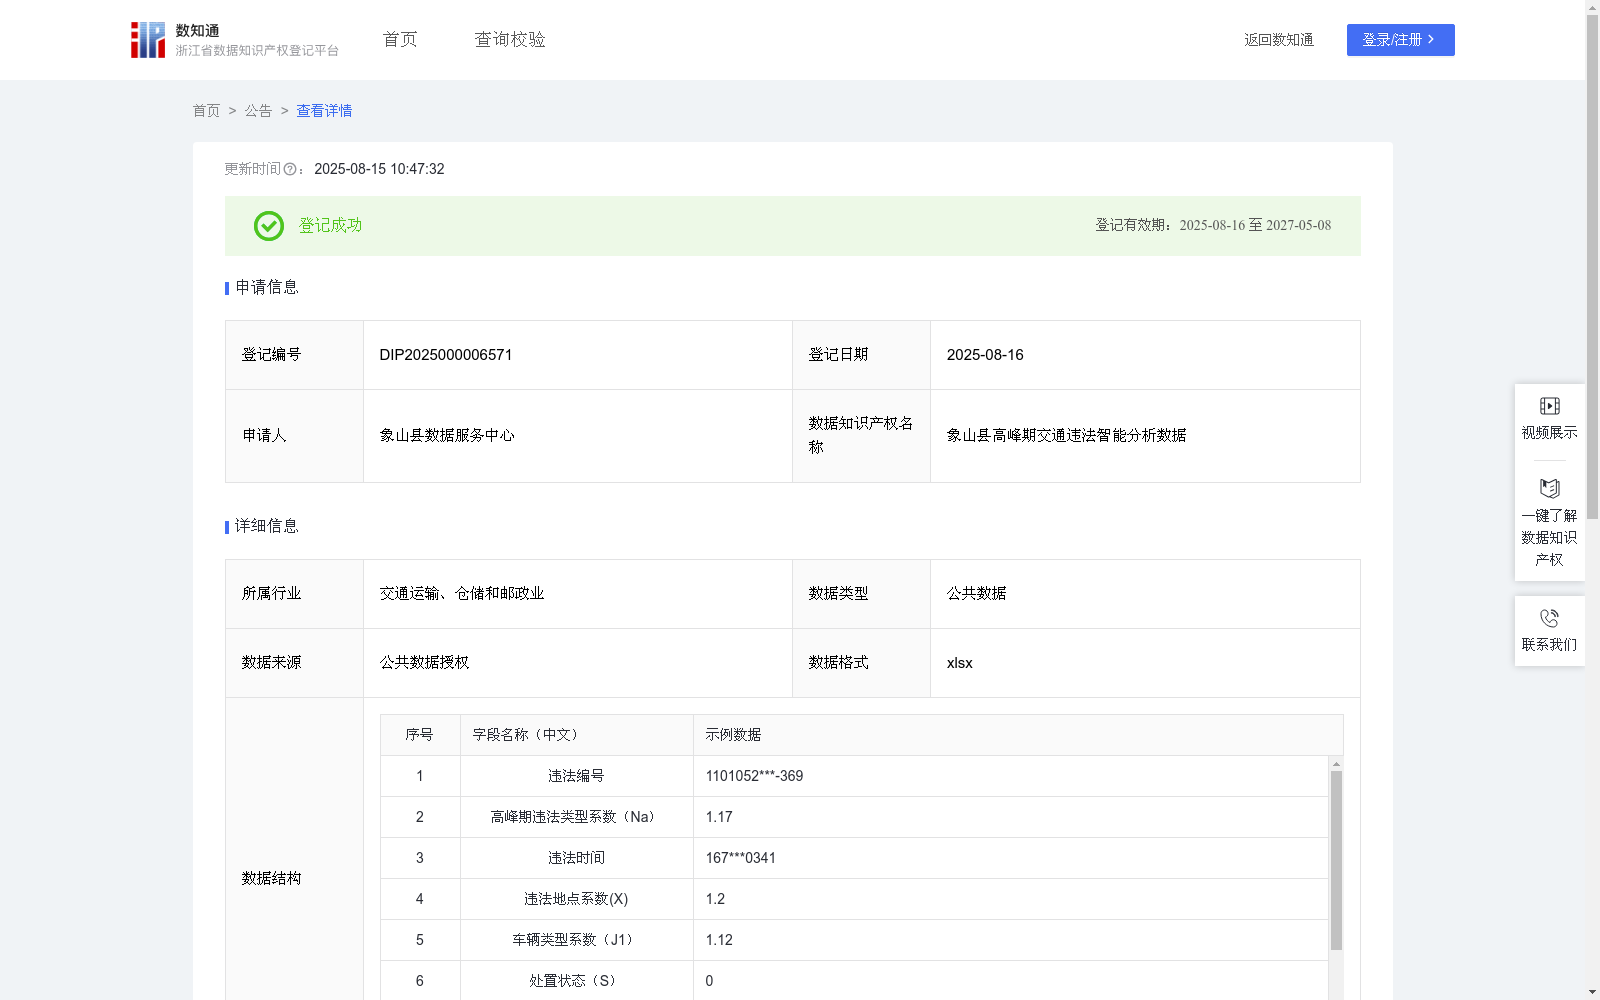
象山县高峰期交通违法智能分析数据
收藏资源简介:
象山县高峰期交通违法风险评估数据为城市交通高峰时段的精准治理提供智能决策支持。该系统通过实时采集早晚高峰时段的车辆轨迹、违法记录和道路拥堵数据,重点识别加塞变道、占用公交车道等高峰特征性违法行为。当模型检测到学校、医院等重点区域在高峰时段风险值超标时,将联动信号系统实施潮汐车道控制并延长行人过街时间,同时根据警力在位率数据生成最优巡逻方案。基于高峰时段事故与违法行为的关联分析,系统能预测如外卖车辆集中穿行等可能引发连锁拥堵的风险组合,提前触发分时禁行等专项预案。通过持续跟踪早、晚高峰的干预效果,模型可动态调整"拥堵关联度"等高峰专属评估参数,形成时段化闭环管理。评估结果既指导高峰勤务的精准部署,也为可变车道设置等设施优化提供数据支撑,实现从全天候防控到高峰时段精准治理的模式升级。根据交通违法处理系统主键获得违法编号;根据抓拍系统识别的违法类型,超速、闯红灯、违停、不礼让行人、未系安全带、违规变道、其他等类型获得违法类型系数Na;根据电子警察设备时间同步时间获得违法时间戳;根据电子警察GPS模块获得经纬度由经纬度获取实时位置并转化为对应地点类型系数(事故多发路段、学校/医院周边、高架/隧道、普通道路)获得违法地点系数X;根据违规车辆类型获得车辆类型系数J1;根据违法处理系统获得处置状态,0:未处理,1:已录入,2:已处罚,3:已申诉,4:已撤销;根据事故处理时间获得处置时效J2;根据事故上报系统关联分析获得关联事故G,0:无关联,1:有关联;高峰期时段系数为1.5;将所有采集汇总数据先基于LECD风险评价法原理优化,量化历史事故数据与违法行为的关联性建立,再通过加权平均法进行计算:Y=Nax0.3+1.5x0.2+Xx0.2+J1x0.15+J2/150x0.15+Gx0.1,最终获得象山县高峰期交通违法智能分析综合违法风险值,当违法风险值在0-0.5区间,为低风险,常规违法行为且无叠加风险因素,纳入电子警察自动记录系统,按常规流程处理;当违法风险值在0.5-1.3区间,为中风险,单一高风险行为或多项低风险行为叠加,启动周度专项治理行动,加强移动测速设备部署,推送警示短信至车主;当违法风险值>1.3,可能涉及危化品车辆或可能引发重大事故,启动多部门联合执法机制,实施临时交通管制,开展事故倒查问责。
The traffic violation risk assessment data during peak hours in Xiangshan County provides intelligent decision-making support for precise urban traffic peak period governance. This system collects real-time vehicle trajectories, violation records and road congestion data during morning and evening peak hours, focusing on identifying peak-specific violations such as lane-cutting and bus lane encroachment. When the model detects that the risk value of key areas such as schools and hospitals exceeds the standard during peak hours, it will link with the signal system to implement tidal lane control and extend pedestrian crossing time, while generating the optimal patrol plan based on the police on-duty rate data. Based on the correlation analysis between accidents and violations during peak hours, the system can predict risk combinations that may trigger chain congestion, such as concentrated traversal of food delivery vehicles, and trigger special emergency plans such as time-based traffic restrictions in advance. By continuously tracking the intervention effects of morning and evening peak hours, the model can dynamically adjust peak-specific assessment parameters such as congestion correlation degree, forming time-phased closed-loop management. The assessment results not only guide the precise deployment of peak traffic duty services, but also provide data support for facility optimization such as variable lane setting, realizing the model upgrade from all-day traffic prevention and control to precise peak period governance. Obtain the violation ID according to the primary key of the traffic violation handling system; obtain the violation type coefficient Na based on the violation types identified by the capture system, including speeding, running a red light, illegal parking, failure to yield to pedestrians, failure to wear a seatbelt, illegal lane change, and other types. Obtain the violation timestamp according to the time synchronization time of the electronic police camera equipment; obtain the longitude and latitude from the GPS module of the electronic police camera, obtain the real-time location from the longitude and latitude, and convert it into the corresponding location type coefficient (accident-prone road segments, school/hospital surrounding areas, elevated roads and tunnels, ordinary roads) to obtain the violation location coefficient X. Obtain the vehicle type coefficient J1 according to the type of violating vehicle; obtain the disposal status from the violation handling system, where 0: Unprocessed, 1: Entered, 2: Penalized, 3: Appealed, 4: Revoked. Obtain the disposal timeliness J2 according to the violation disposal handling time; obtain the associated accident G through correlation analysis of the accident reporting system, where 0: No association, 1: Associated; the peak period coefficient is 1.5. All collected and aggregated data are first optimized based on the principles of the LECD risk assessment method, and the correlation between historical accident data and violations is quantified. Then the calculation is carried out through the weighted average method: Y = Na * 0.3 + 1.5 * 0.2 + X * 0.2 + J1 * 0.15 + (J2 / 150) * 0.15 + G * 0.1. Finally, the comprehensive violation risk value of Xiangshan County's peak-hour traffic violation intelligent analysis is obtained. When the violation risk value is in the range of 0-0.5, it is low-risk, referring to conventional violations without superimposed risk factors, which is included in the electronic police automatic recording system for processing according to conventional procedures. When the violation risk value is in the range of 0.5-1.3, it is medium-risk, referring to a single high-risk behavior or the superposition of multiple low-risk behaviors. Launch weekly special governance actions, strengthen the deployment of mobile speed measurement equipment, and send warning SMS to vehicle owners. When the violation risk value is greater than 1.3, it may involve hazardous materials (HazMat) vehicles or trigger major accidents. Launch a multi-department joint law enforcement mechanism, implement temporary traffic control, and conduct retrospective accident investigation and accountability.