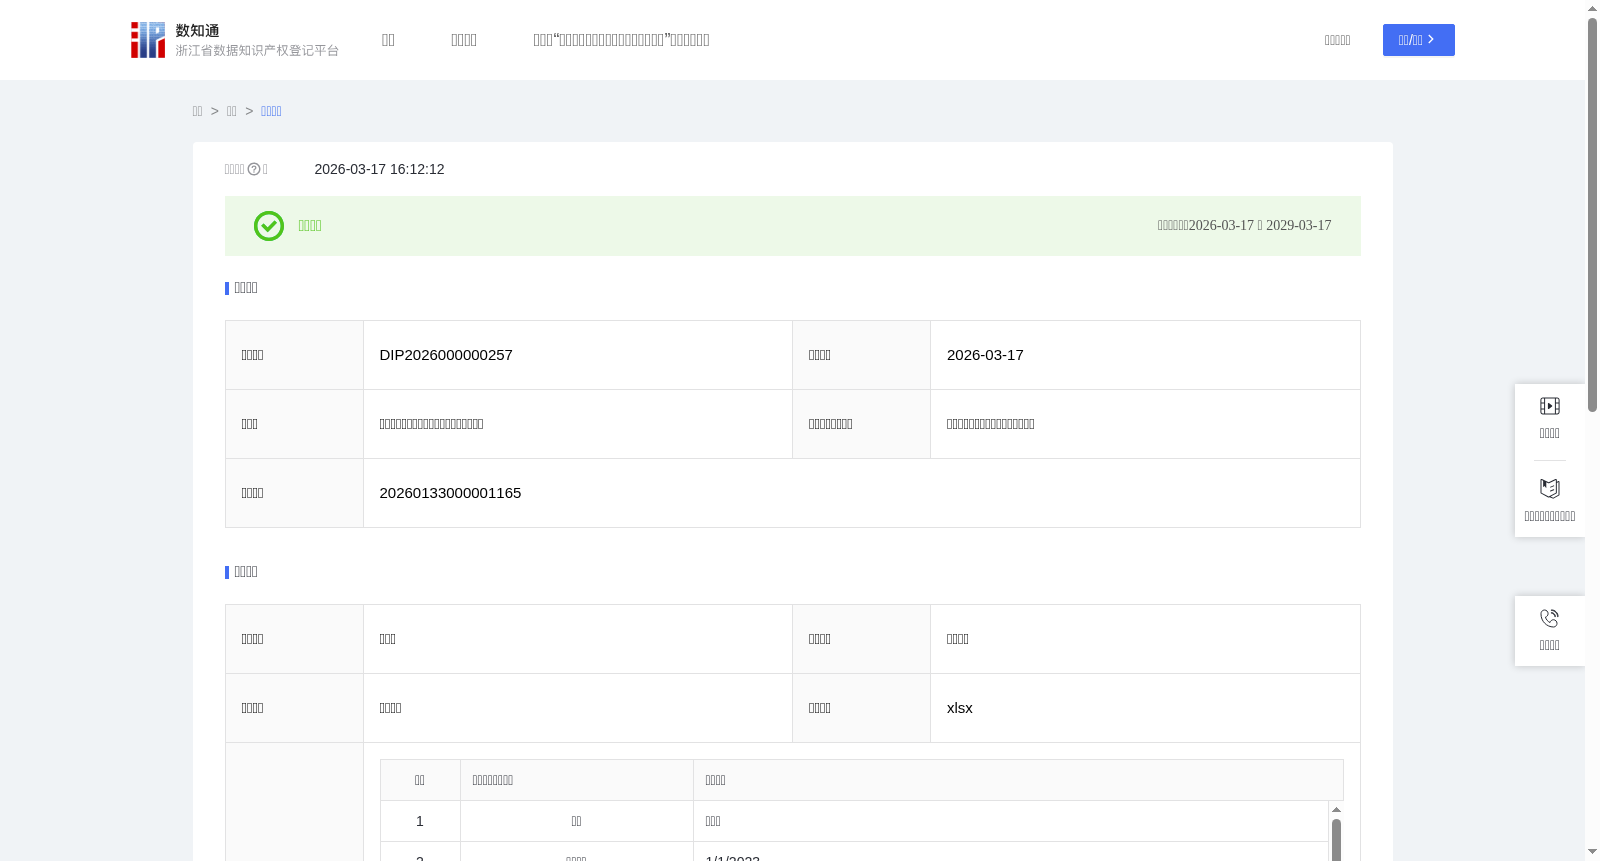
区域纺织产业订单交付效能评估数据
收藏资源简介:
本数据集旨在量化评估区域纺织产业订单交付的综合效能,为区域管理者、产业链上下游企业及相关决策方提供关键洞察。通过整合订单交付及时率、生产周期效率及质量稳定性等多维度数据,生成综合交付效能指数,该数据集能够有效解决传统评估中片面、孤立的问题,实现对整个订单交付流程协同效率的科学度量,可应用于区域纺织产业供应链的效能对标与优化。1.加工前数据说明: 采集绍兴市柯桥区印染企业的生产业务数据,数据来源为企业内部ERP系统中的订单、工单、仓储记录。采集的基础数据以“日”为最小时间粒度,基础采集信息包括:订单创建日期、订单交付日期、订单修改日期、开卡日期、出库日期等数据,这些字段为交付效能分析的基础数据来源。 2.处理规则: 对采集到的原始生产数据进行清洗和标准化处理: 去除重复、无效工单,确保分析对象为真实完成或执行中的订单;对缺失关键时间节点(如未开卡、未入库)的记录进行标记处理,避免直接参与均值计算,防止对结果造成干扰;按照“分析日期”维度进行汇总,形成反映区域纺织产业交付能力的综合时间序列数据; 3.数据内容描述: 基于清洗后数据,通过特定算法进行计算和特征提取,生成最终用于评估的数据集字段。各字段的算法规则说明如下: 1订单交付及时率(%)=(当日准时交付订单数/当日总订单数)×100%。反映了企业订单履约的时效性能力。 2订单变更率(%)=(当日变更需求订单数/当日总订单数)×100%。反映客户需求的波动性及沟通的准确度。 3订单到开卡平均周期(天)=所有订单(订单开卡时间-订单创建时间)的时间差之和÷订单数。反映了订单处理和生产准备环节的效率。 4开卡到出库平均周期(天)=所有订单(订单出库时间-订单开卡时间)的时间差之和÷订单数。反映了实际生产执行与产品交付环节的效率。 5综合交付效能指数=(订单交付及时率÷100×α)+(1-订单变更率÷100)×β+(1/(订单到开卡平均周期+开卡到出库平均周期))×γ。 其中,权重系数取值分别为α=0.5,β=0.2,γ=0.3。算法旨在评估交付的最终结果,因此赋予交付及时率最高权重;同时考虑生产节奏的稳定性,对各阶段周期进行加权处理。 指数(x)分级: A(0.8<x≤1):交付效能极佳,订单准时率高、变更少、生产周期短,整体协同效率突出,可作区域标杆。 B(0.6<x≤0.8):交付效能良好,履约稳定,周期控制较好,具备较强市场竞争力,仍有小幅优化空间。 C(0.5<x≤0.6):交付效能一般,履约正常,但存在一定变更或周期偏长,需关注流程协同与稳定。 D(0.3≤x≤0.5):交付效能较弱,延迟或变更较多,生产周期较长,需系统性优化与资源调配。 E(x<0.3):交付效能差,履约问题突出,流程协同效率低,建议专项整改与效能提升。
This dataset aims to quantitatively evaluate the comprehensive delivery efficiency of regional textile industry orders, providing critical insights for regional administrators, upstream and downstream enterprises in the industrial chain, and relevant decision-making stakeholders. By integrating multi-dimensional data such as order on-time delivery rate, production cycle efficiency, and quality stability, a comprehensive delivery efficiency index is generated. This dataset effectively addresses the issues of one-sided and isolated evaluation in traditional assessment methods, enabling scientific measurement of the collaborative efficiency across the entire order delivery process, and can be applied to efficiency benchmarking and optimization of regional textile industry supply chains. 1. Pre-Processing Data Description: Production operation data of printing and dyeing enterprises in Keqiao District, Shaoxing City is collected, with data sourced from order, work order, and warehouse inventory records within the enterprise's internal ERP system. The minimum time granularity of the collected basic data is "day", and the basic collected information includes: order creation date, order delivery date, order modification date, order activation date, warehouse outbound date, and other data. These fields serve as the foundational data source for delivery efficiency analysis. 2. Processing Rules: The collected raw production data is cleaned and standardized: Remove duplicate and invalid work orders to ensure that the analyzed objects are orders that have been actually completed or are currently in execution; mark records with missing key time nodes (such as unactivated orders or unwarehoused goods) to avoid their direct participation in average value calculations and prevent interference with the analysis results; aggregate the data according to the "analysis date" dimension to form a comprehensive time series dataset that reflects the delivery capacity of the regional textile industry. 3. Data Content Description: Based on the cleaned data, calculations and feature extraction are performed using specific algorithms to generate the final dataset fields for evaluation. The algorithm rules for each field are explained as follows: 1. Order On-Time Delivery Rate (%) = (Number of orders delivered on time on the current day / Total number of orders on the current day) × 100%. This metric reflects the timeliness capability of enterprise order fulfillment. 2. Order Change Rate (%) = (Number of orders with demand changes on the current day / Total number of orders on the current day) × 100%. This metric reflects the volatility of customer demand and the accuracy of communication. 3. Average Order-to-Activation Cycle (days) = (Sum of time differences for all orders: Order Activation Date - Order Creation Date) ÷ Total Number of Orders. This metric reflects the efficiency of order processing and production preparation links. 4. Average Activation-to-Outbound Cycle (days) = (Sum of time differences for all orders: Order Outbound Date - Order Activation Date) ÷ Total Number of Orders. This metric reflects the efficiency of actual production execution and product delivery links. 5. Comprehensive Delivery Efficiency Index = (Order On-Time Delivery Rate ÷ 100 × α) + (1 - Order Change Rate ÷ 100) × β + (1 / (Average Order-to-Activation Cycle + Average Activation-to-Outbound Cycle)) × γ. Among them, the weight coefficients are set as α=0.5, β=0.2, and γ=0.3 respectively. The algorithm aims to evaluate the final delivery outcome, so the highest weight is assigned to the on-time delivery rate; meanwhile, the stability of production rhythm is considered, and the cycles of each stage are weighted accordingly. Index (x) Grading: A (0.8 < x ≤ 1): Excellent delivery efficiency, with high on-time order rate, few demand changes, short production cycles, outstanding overall collaborative efficiency, and can serve as a regional benchmark. B (0.6 < x ≤ 0.8): Good delivery efficiency, with stable order fulfillment, good cycle control, strong market competitiveness, and still has a small room for optimization. C (0.5 < x ≤ 0.6): General delivery efficiency, with normal order fulfillment, but certain demand changes or long production cycles exist, requiring attention to process collaboration and stability. D (0.3 ≤ x ≤ 0.5): Weak delivery efficiency, with more delays or demand changes, long production cycles, requiring systematic optimization and resource allocation. E (x < 0.3): Poor delivery efficiency, with prominent order fulfillment issues, low process collaborative efficiency, and special rectification and efficiency improvement are recommended.