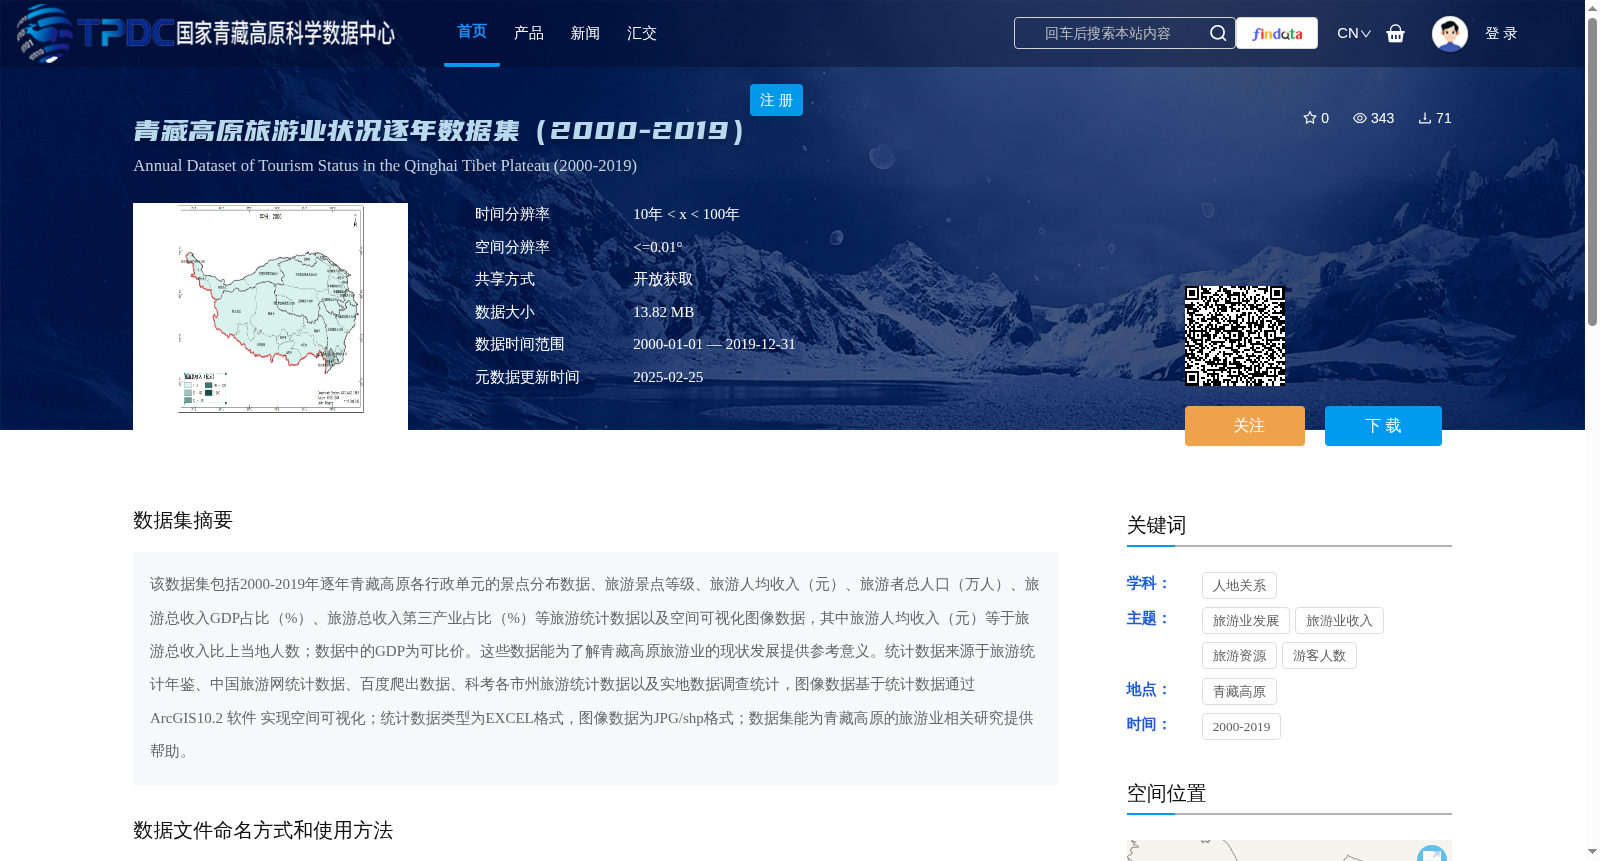
青藏高原旅游业状况逐年数据集(2000-2019)
收藏资源简介:
该数据集包括2000-2019年逐年青藏高原各行政单元的景点分布数据、旅游景点等级、旅游人均收入(元)、旅游者总人口(万人)、旅游总收入GDP占比(%)、旅游总收入第三产业占比(%)等旅游统计数据以及空间可视化图像数据,其中旅游人均收入(元)等于旅游总收入比上当地人数;数据中的GDP为可比价。这些数据能为了解青藏高原旅游业的现状发展提供参考意义。统计数据来源于旅游统计年鉴、中国旅游网统计数据、百度爬出数据、科考各市州旅游统计数据以及实地数据调查统计,图像数据基于统计数据通过ArcGIS10.2 软件 实现空间可视化;统计数据类型为EXCEL格式,图像数据为JPG/shp格式;数据集能为青藏高原的旅游业相关研究提供帮助。
This dataset contains year-by-year tourism-related statistical data and spatially visualized image data for each administrative unit on the Qinghai-Tibet Plateau spanning 2000 to 2019. The statistical data include: scenic spot distribution data, tourist attraction ratings, per capita tourism income (yuan), total number of tourists (ten thousand persons), the proportion of total tourism income in regional GDP (%), and the proportion of total tourism income in the tertiary industry (%). Specifically, per capita tourism income (yuan) is calculated as total tourism revenue divided by the local resident population, and all GDP data herein are at comparable prices. The statistical data are sourced from tourism statistical yearbooks, official statistical data from China Tourism Network, web-crawled data from Baidu, tourism statistical data from prefecture-level cities collected via scientific research surveys, and on-site field investigation and statistics. The spatially visualized image data are generated using ArcGIS 10.2 software based on the aforementioned statistical data, with the statistical data stored in Excel format and the image data available in JPG and SHP formats. This dataset can serve as a reference for understanding the current development status of tourism on the Qinghai-Tibet Plateau, and provides valuable support for relevant tourism research in this region.